Metrics API Grafana Integration
Prerequisites
- Grafana ≥ 9.1.0
- Embrace Metrics API Token. This can be found in the Settings page of the Dashboard.
Setting Up Embrace as a Data Source
Follow these steps to add Prometheus as a data source in the Grafana dashboard:
- Click the gear icon to go to the Configurations page.
- Click on "Add data source" and select Prometheus.
- Name your source "embrace-metrics-api" and set the following fields:
URL:https://api.embrace.io/metrics- Under
Custom HTTP Headers, add a header with a nameAuthorizationand useBearer <YOUR_API_TOKEN>as your token string. For example, if your API token ise2d75f07a40843f0b8a53d1e3201edba, your token string should beBearer e2d75f07a40843f0b8a53d1e3201edba.
Importing Dashboard JSON
Use the provided JSON file that is pre-populated with common queries. To add the dashboard to Grafana, click on the Dashboards icon and select + Import. Click on the Upload JSON file button. You may be asked to change the uid of the dashboard if some other dashboard already has that name. You can set it to something like a-0000000.
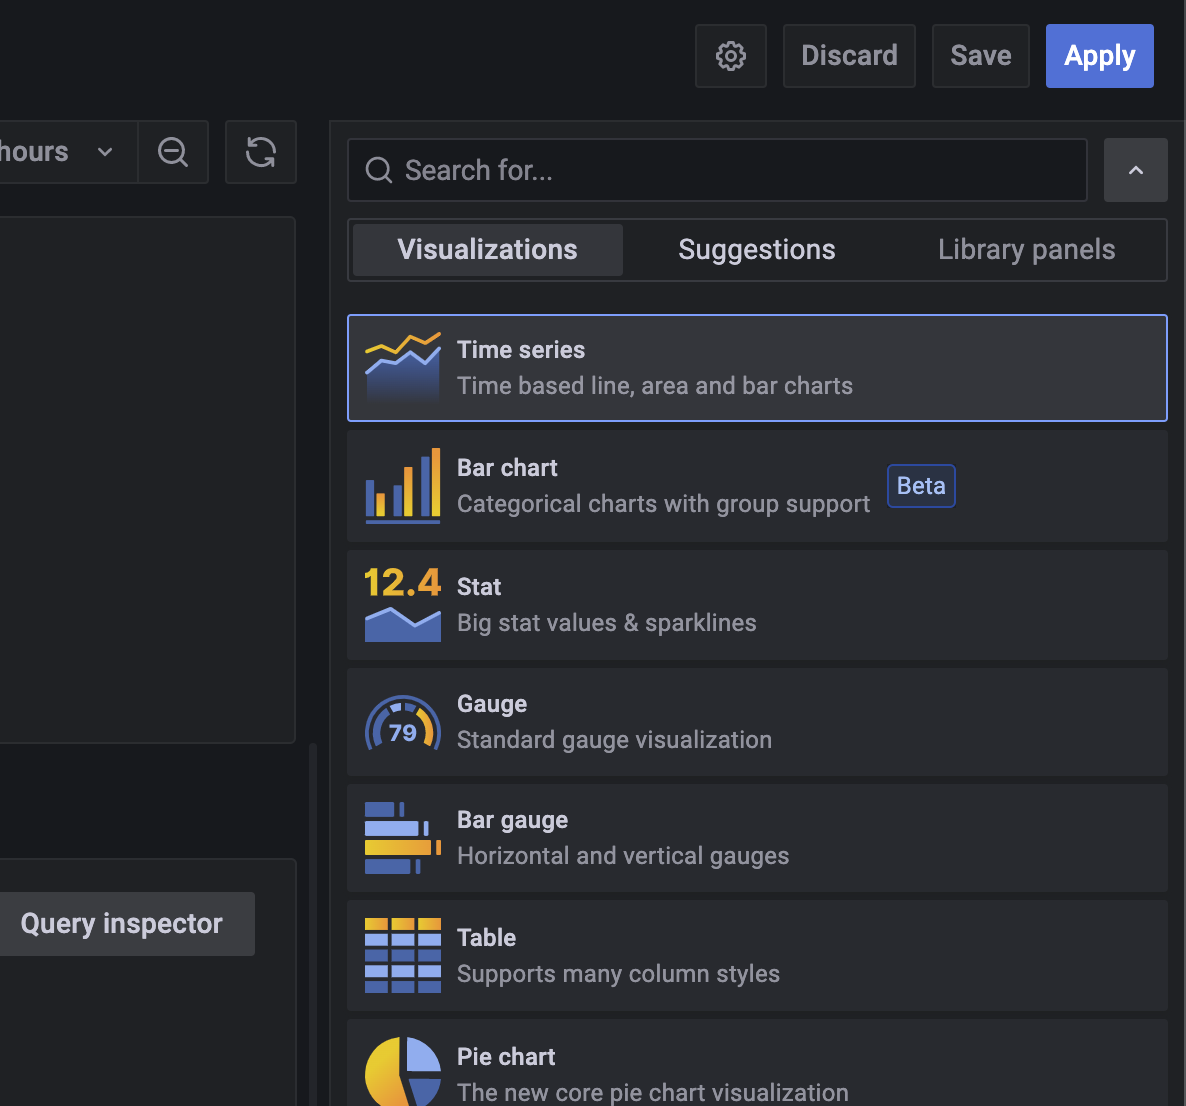
Creating Time Series
Add a new panel and set the visualization to "Time series".
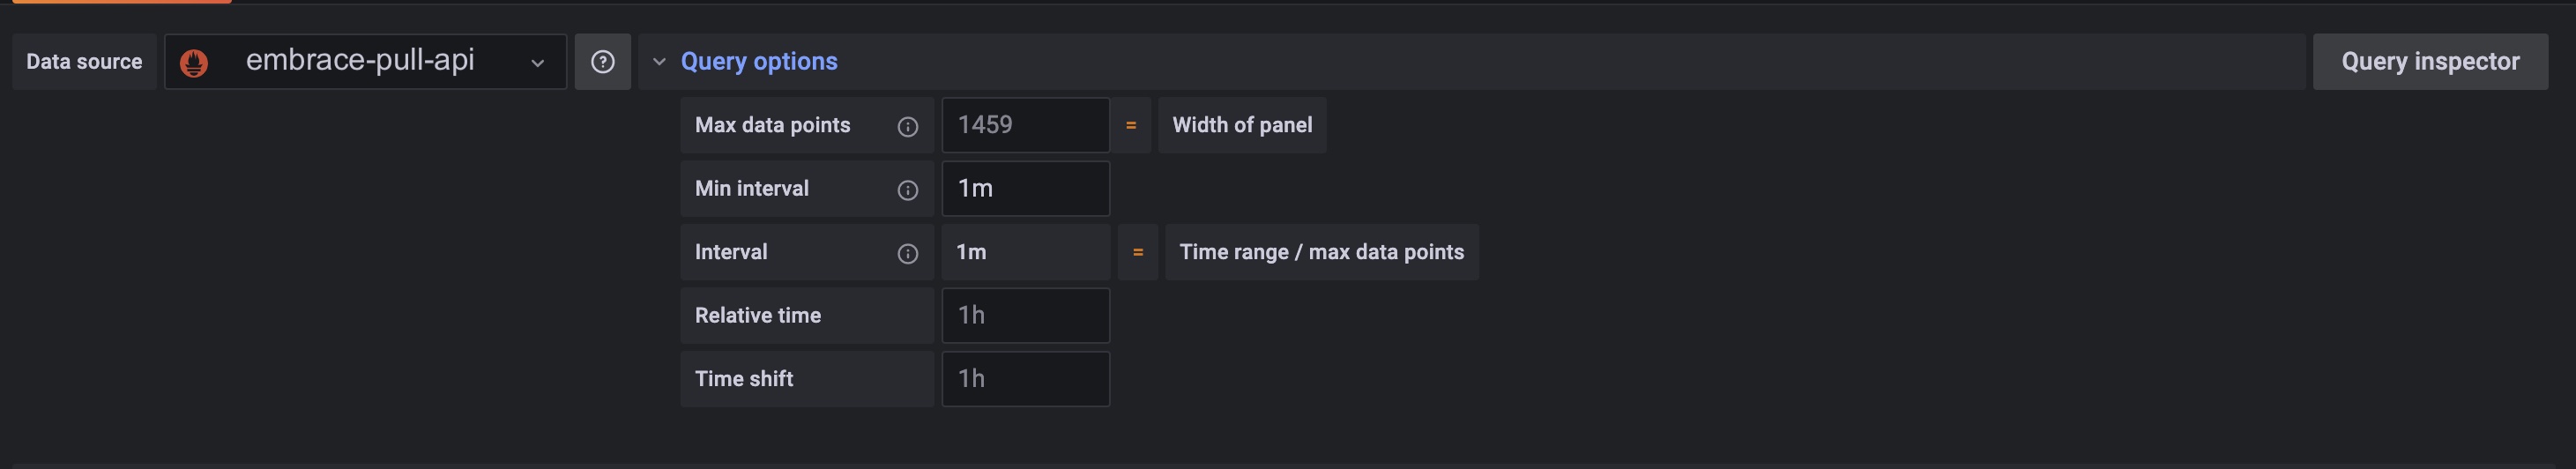
Set the data source to "embrace-metrics-api:. In the "Query options" section set the "Min interval". Currently only the following intervals are supported: 1m, 5m, 10m, 15m, 30m, 1hr, and 1d. Keep in mind that Prometheus only supports 11,000 points per time series.
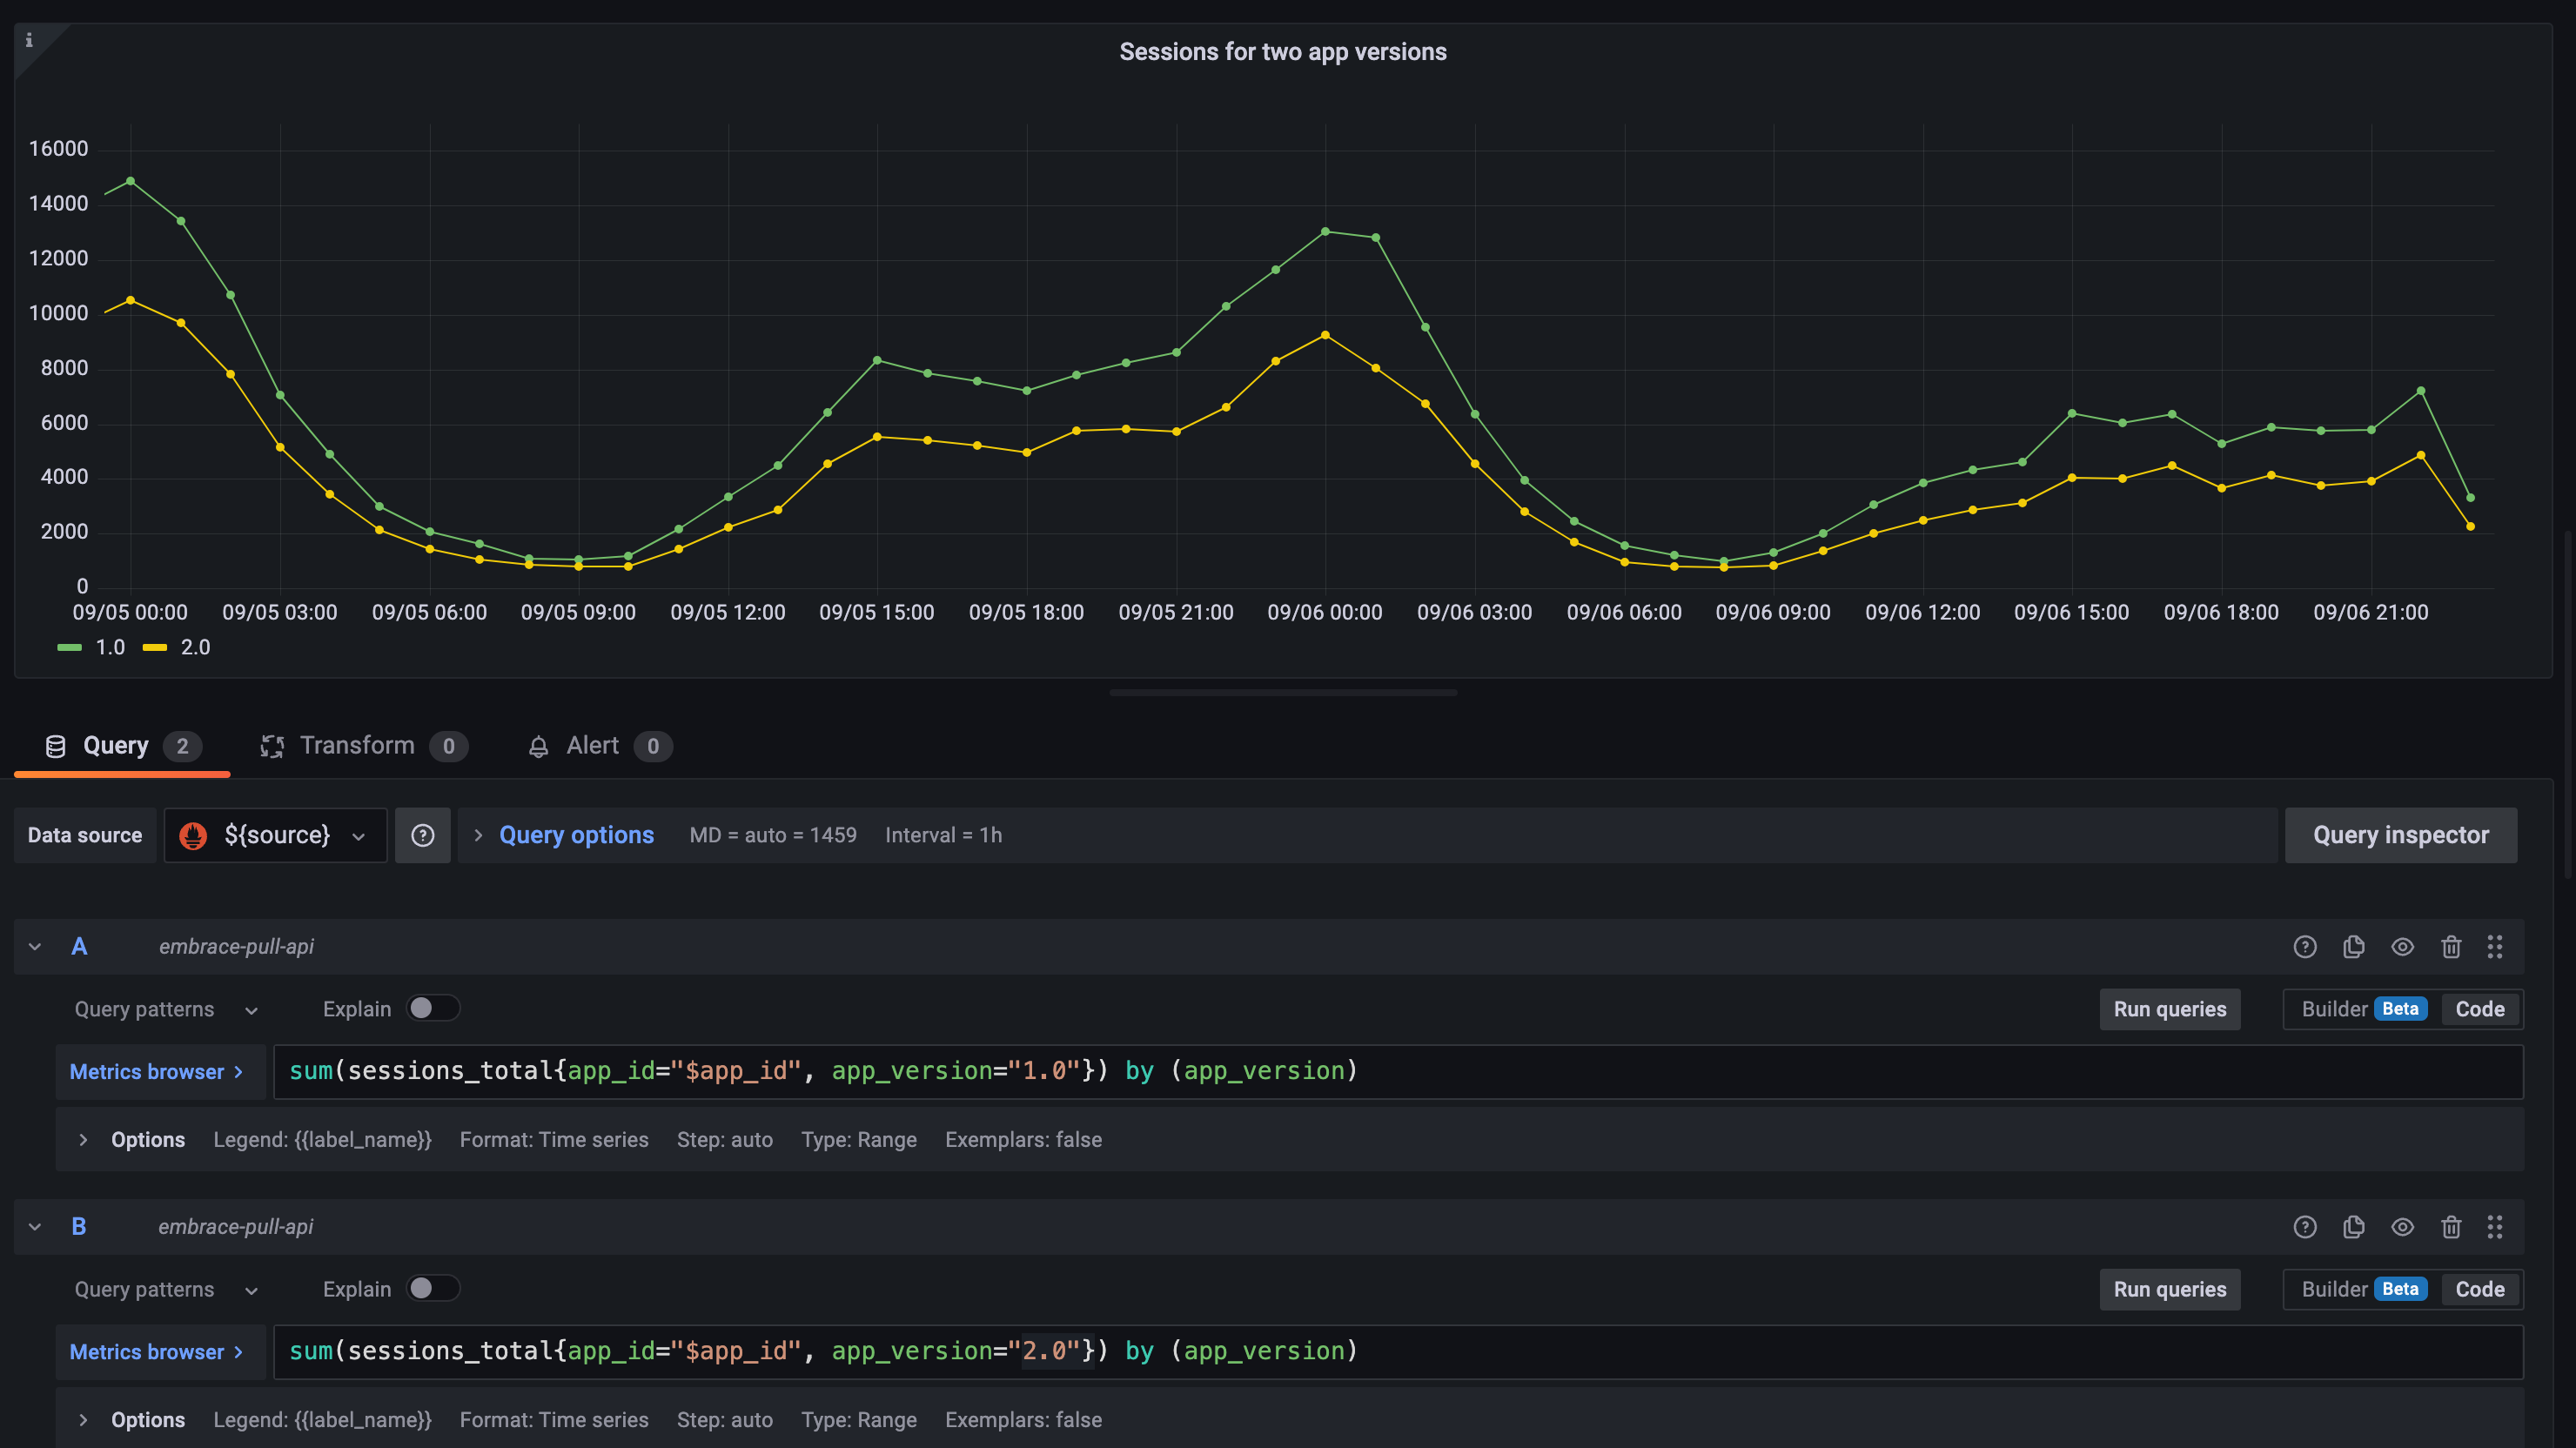
The following PromQL query will provide a time series graph for total sessions for your app.
hourly_sessions_total{app_id="<app ID>"}
You'll notice that this gives you several time series, one for each combination of app version and OS version. We can make these more useful by grouping by app version. Each time series now shows the total sessions grouped by app version.
sum(hourly_sessions_total{app_id="<app ID>"}) by (app_version)
You can filter by an app version by specifying it in the expression
hourly_sessions_total{app_id="<app ID>", app_version="1.2.3"}
You can visualize multiple app versions in the same graph by creating multiple queries and filtering by each desired app version.
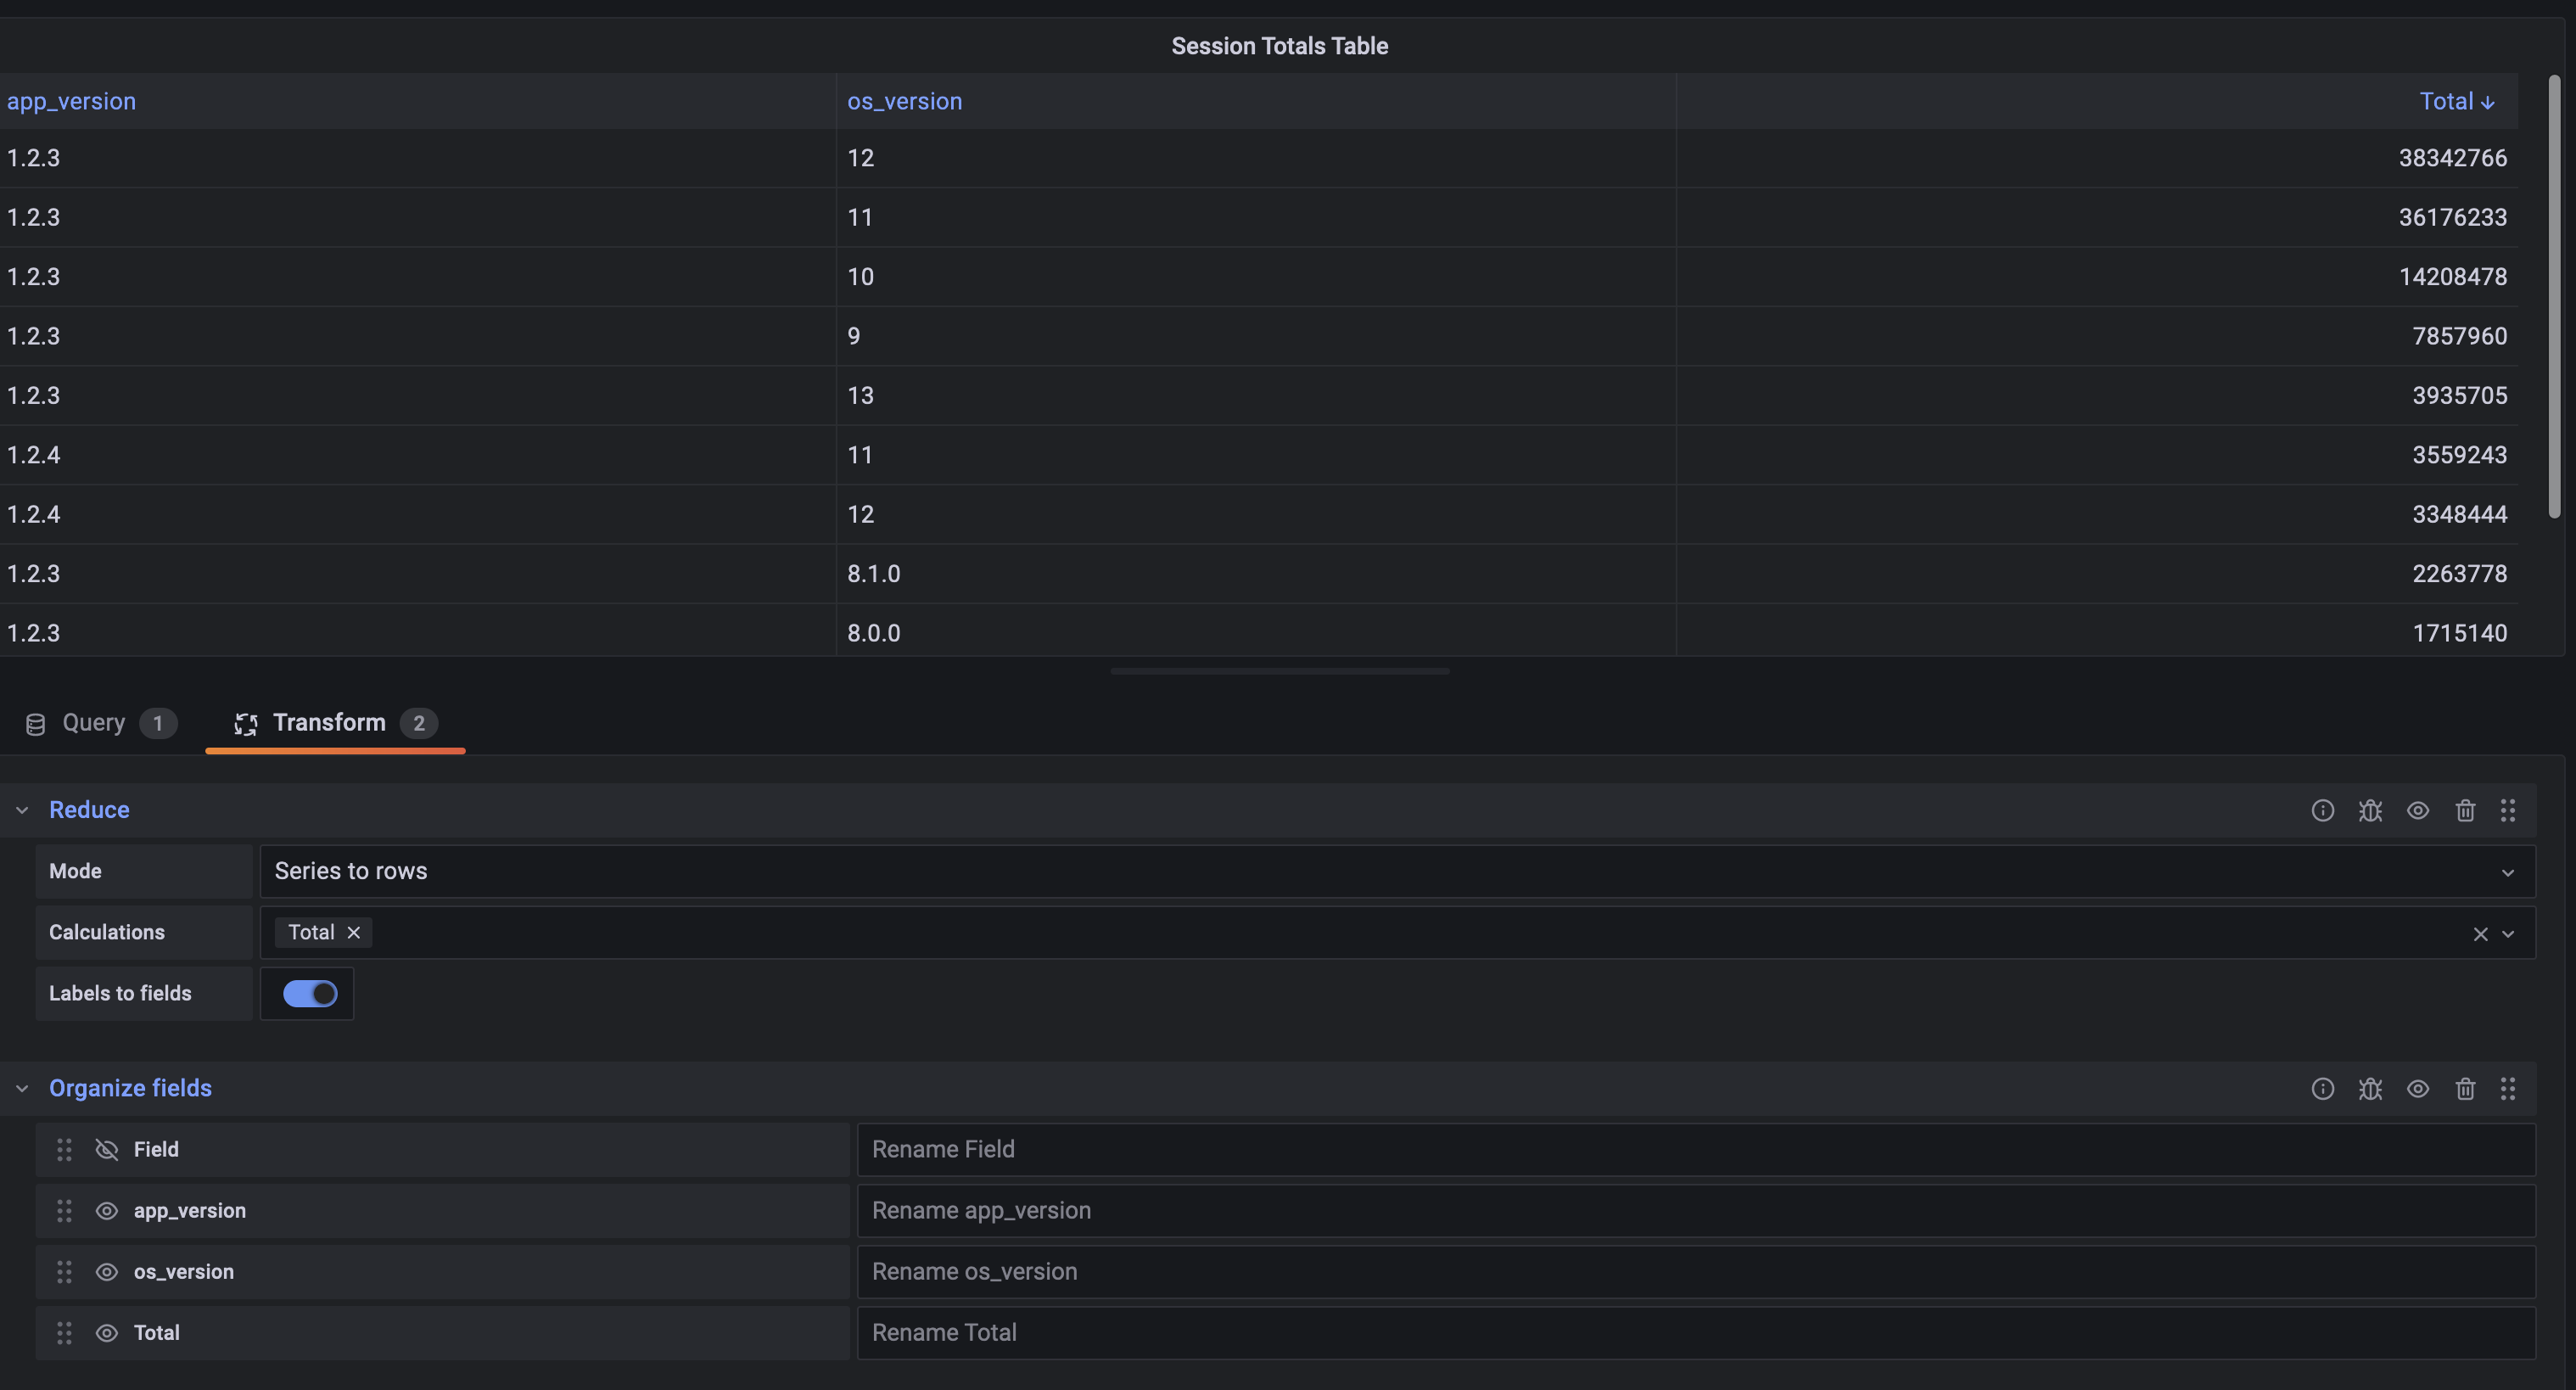
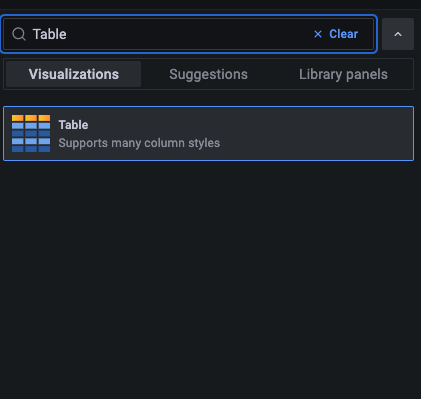
Creating Tables
Add a new panel and select the Table visualization.
Add a query. For our example, we’ll see the session counts grouped by app version and OS version in descending order.
sum(hourly_sessions_total{app_id="<app ID>"}) by (app_version, os_version)
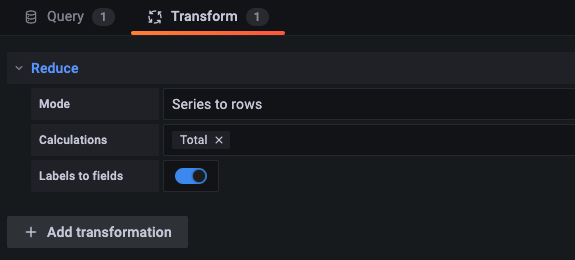
Select the Transform tab and add the Reduce transform. Set Mode to "Series to rows", Calculations to "Total", and turn "Labels to fields" on.
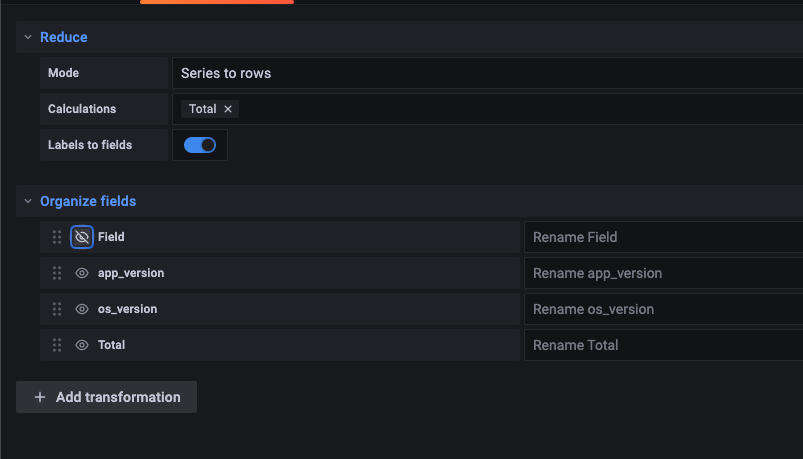
The table should now have the columns Field, app_version, os_version, and Total. Let’s get rid of that "Field" column.
Add a new transformation, "Organize fields". You’ll see that each column can be renamed or hidden. Click the eye icon to hide the "Field" column.
Finally, you can sort the rows in descending order by clicking on the label for the Total order.