Alerting
You can set up alerts for various types of issues, including crashes, ANRs, error logs, networking problems, and more.
Alert Creation
You can create a new alert by navigating to the Alerts page and clicking on the "Add Alert" button or by using the shortcut from an existing Widget or Custom Metric.
Alert Creation from Existing Widget
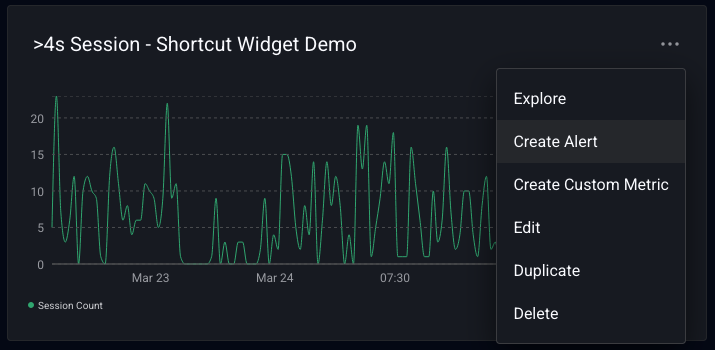
To create an alert using the same conditions in a widget, go to the specific widget and click on the "more" icon in the top right of the widget. If an alert is able to be created from the conditions being used, you can select Create Alert. This will take you to the Alerts creation page to specify the rest of the details below.
Alert Creation from Existing Custom Metric
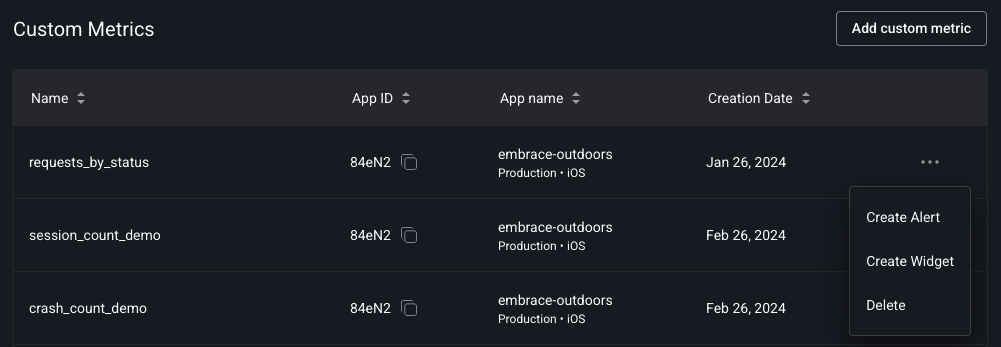
To create an alert using the conditions set in a Custom Metric, go to the Custom Metric of interest in App Settings > Custom Metrics and click the "more" icon (three dots) on the Custom Metric you want to use.
Alert Type
Begin by selecting the metric you wish to be alerted on. For example, you may want to receive notifications when the percentage of users experiencing a crash exceeds 50%.
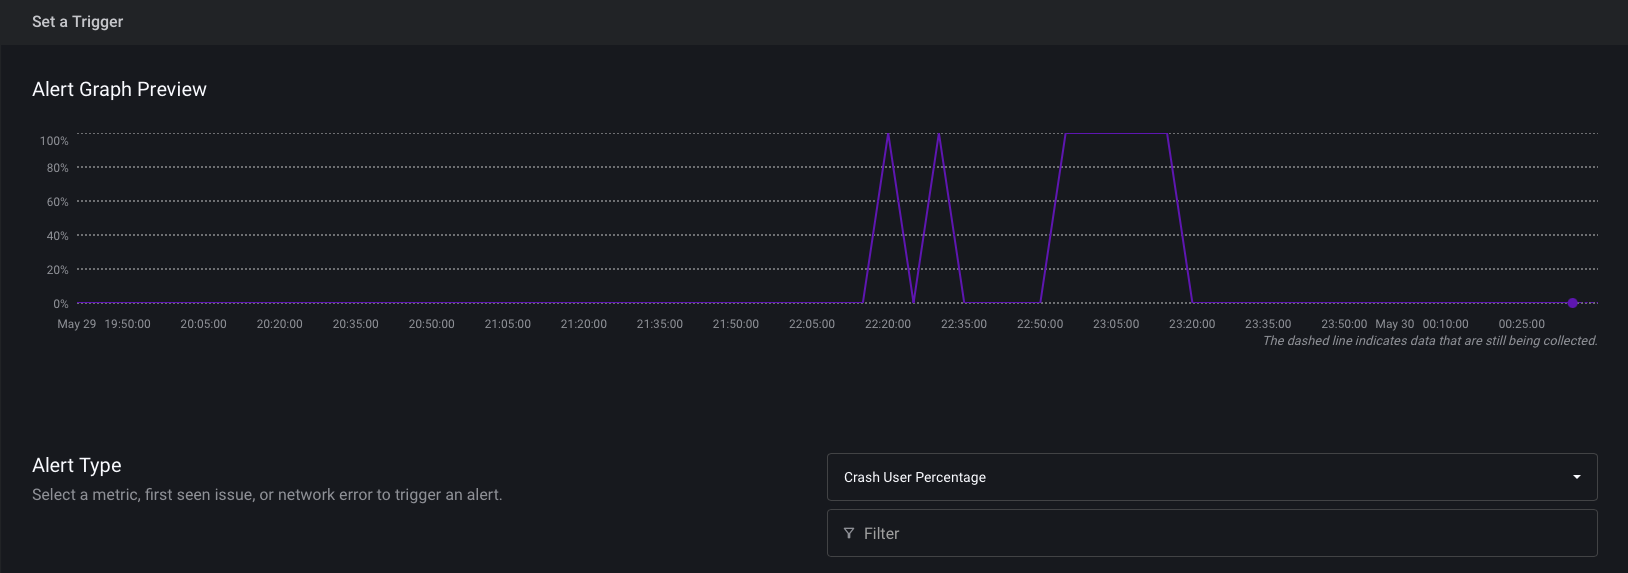
After selecting a metric, you'll see a preview of historical data over time for the chosen metric. Additionally, you can apply filters such as app version, build, country, etc.
Trigger Thresholds
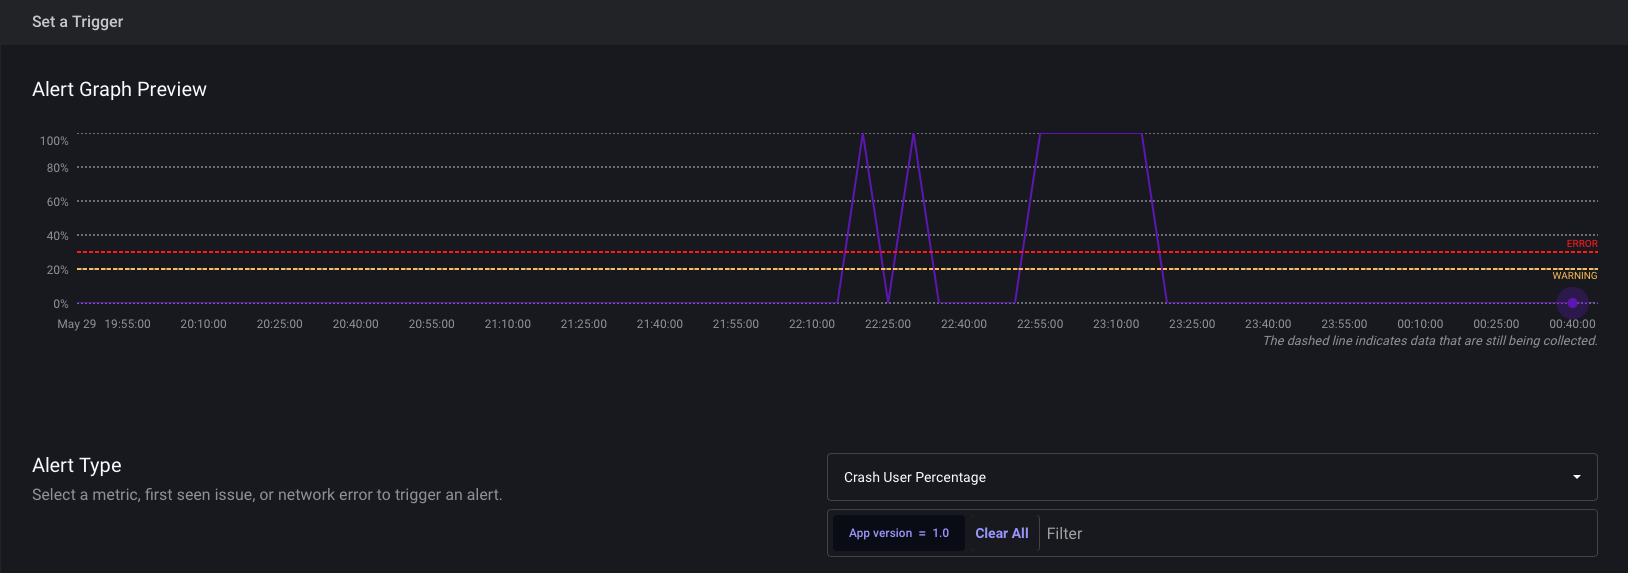
Specify the evaluation time period and the number of affected users required to trigger the alert. You can also set error and warning thresholds, which will be visible in the preview for further adjustment.
Notification Recipients
Choose which team members should receive notifications when the alert is triggered. Notifications can be sent via email, Slack, or webhook.
Finally, name the alert for easy identification, knowing you can always change it later.
Alert Ownership
Assign an owner to each alert to provide clear visibility on who is responsible. While ownership doesn’t grant special permissions, it helps teams quickly identify the point of contact for an alert. Each alert can have only one owner, who must be part of the organization.
Monitoring
Once your alert is set up, you'll find it listed under "Manage Alerts". Here, you can also view currently triggered alerts under "Triggered Alerts" and access the history of previously triggered alerts.
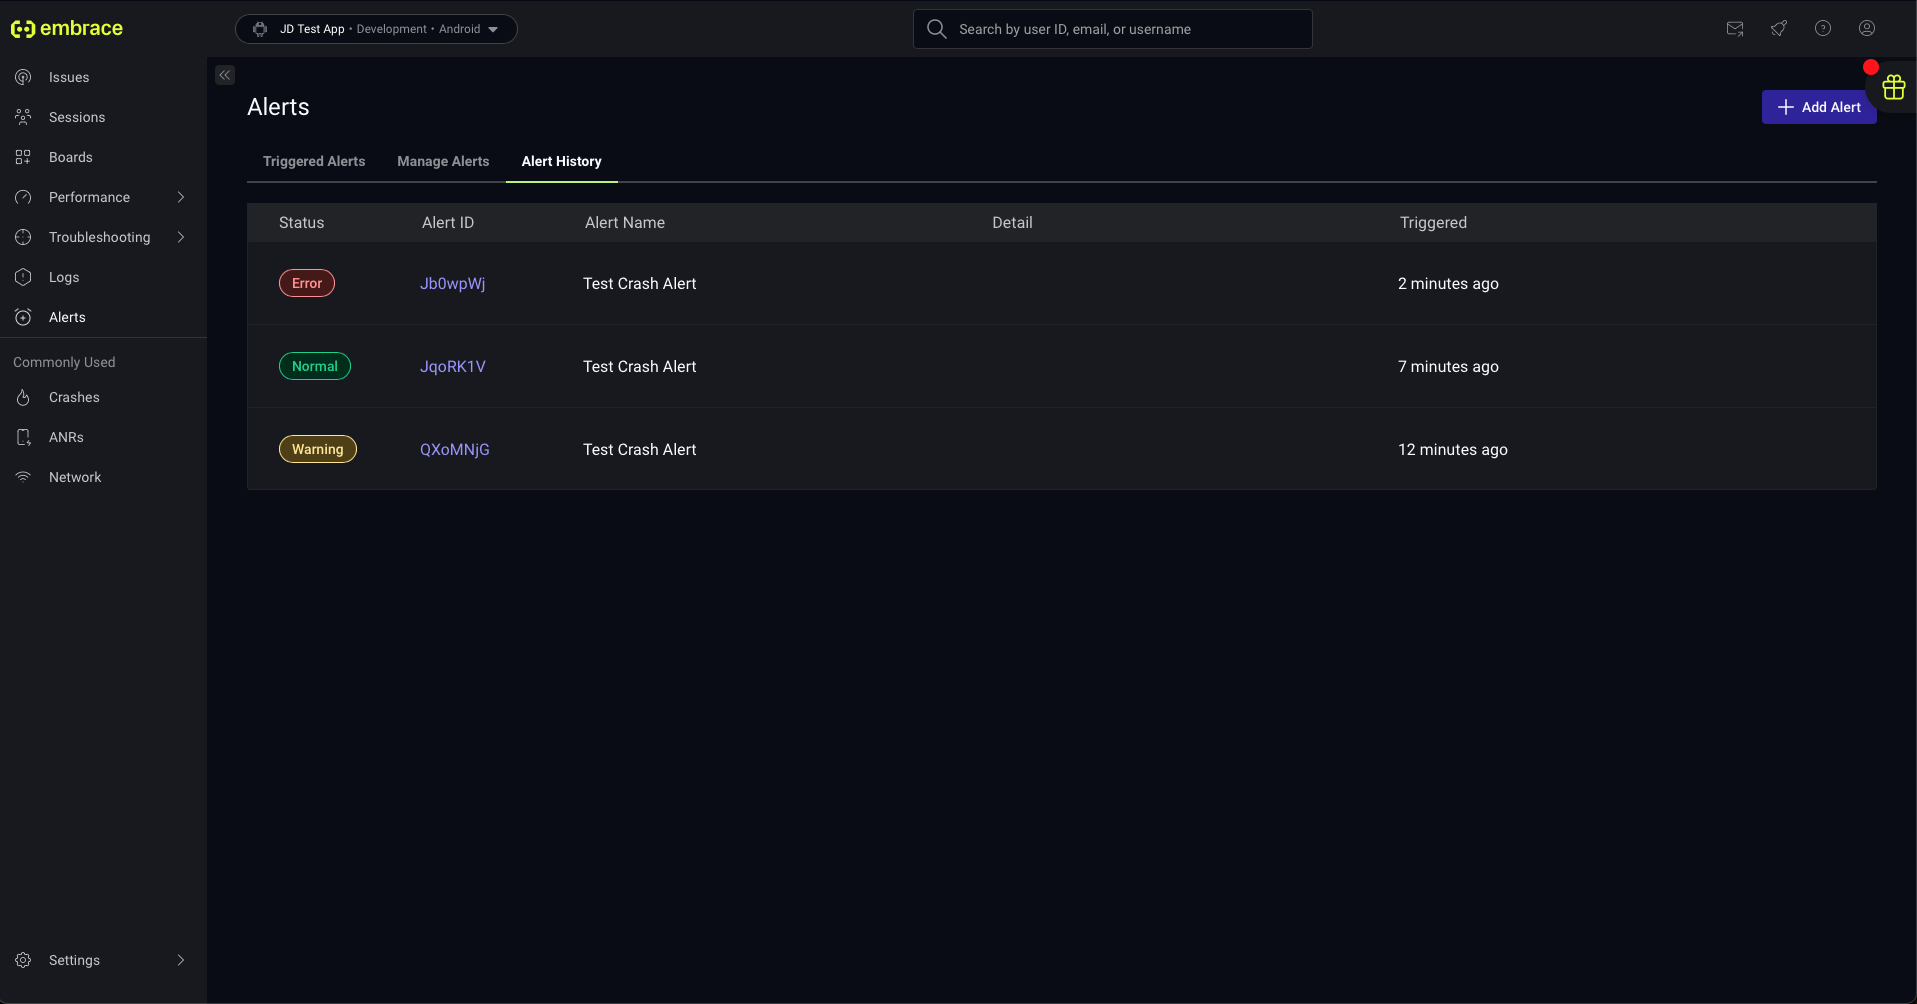
Statuses
- Normal: No issues; alert has recovered or conditions are within thresholds.
- Warning: Alert has hit warning thresholds; no critical issues in progress.
- Error: Critical issue in progress; error thresholds exceeded.
- Inactive: Alert is disabled or misconfigured; no thresholds set or notifications enabled.
- Muted: Alerts is silenced; no notifications sent.
Alert Data vs Latest Data
Mobile data presents a unique challenge: it can be delayed due to factors such as offline devices, intermittent internet connectivity, or other disruptions.
When our system processes an alert, it evaluates the data received at that specific point in time. The system assumes that the available data represents the most complete and accurate snapshot at that moment. Alerts are triggered (or not) based on this dataset, which may exclude some delayed data that has not yet arrived.
To provide a clear understanding of the data over time, our system visualizes two datasets:
- Alert data: The data available at the time the alert was triggered.
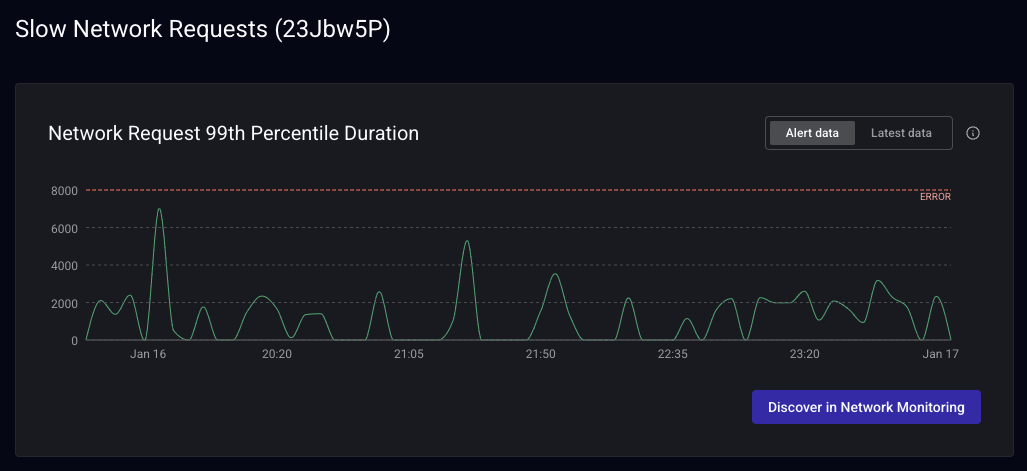
- Latest data: Combines alert data with data received after the alert, matching what you see in the rest of the Embrace platform.
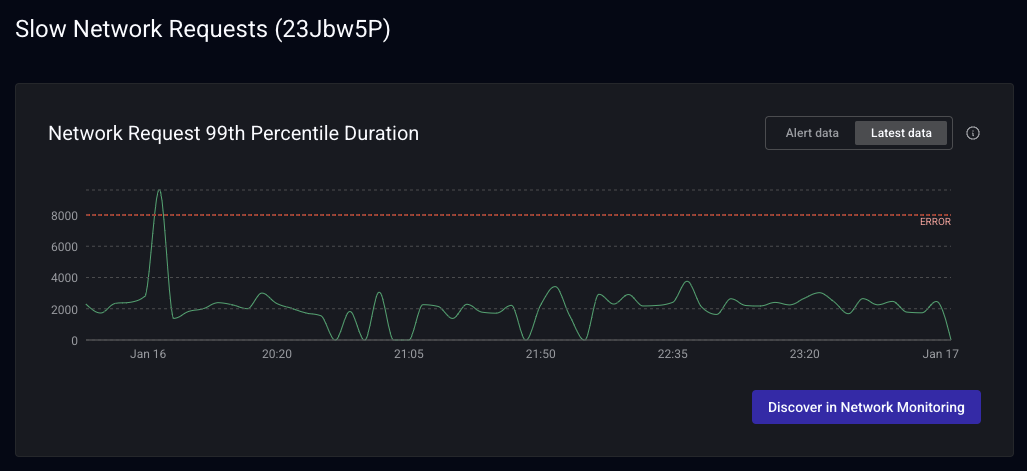
This approach enables users to compare the state of the data during alert processing with the fuller picture that becomes available later. These comparisons help illustrate the impact of delayed data on analytics and ensure transparency in alerting decisions.
Why is my alert inactive?
Your alert is inactive because one or more of the following conditions are met:
- The email notification is using a disabled email.
- No notification methods (email or Slack) are configured.
To activate the alert, ensure notification methods are enabled and thresholds/percentages are properly configured for monitoring.
Email
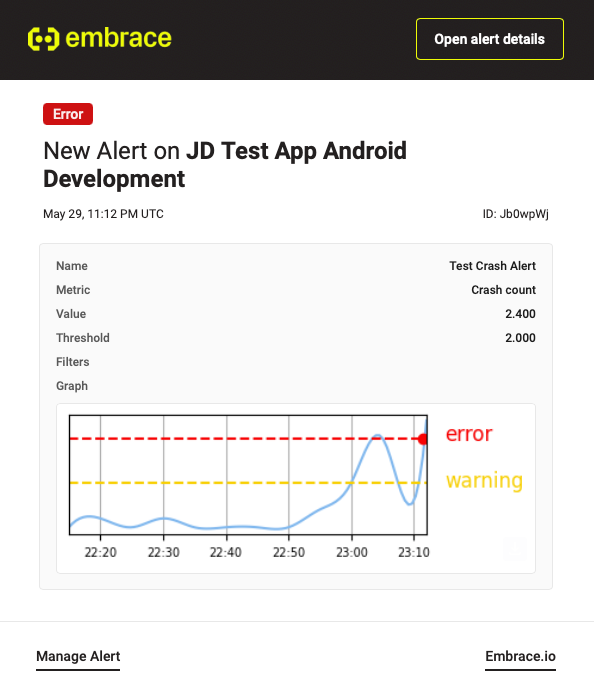
Here's how an alert email looks:
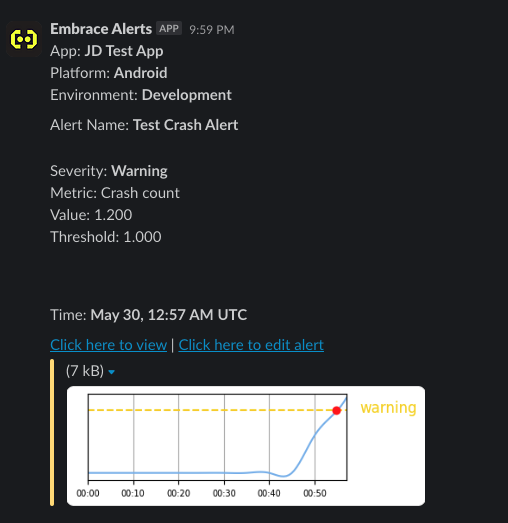
Slack Message
This is the format of a Slack message for an alert:
Webhook
Here's a sample webhook data for an alert:
{
  "msg": "",
  "version": "1.0",
  "alert": {
    "id": "Ev626Vv",
    "name": "Test Crash Alert",
    "type": "metric",
    "metric_props": {
      "dynamic_filters": [],
      "error_level": "2.000",
      "error_recover_level": "N/A",
      "evaluation_method": "greater than",
      "filters": [],
      "group_by": "",
      "metric": "Crash count",
      "min_count": null,
      "warning_level": "1.000",
      "warning_recover_level": "N/A",
      "window_function": "average",
      "window_size_in_secs": 300
    }
  },
  "app": {
    "environment": "Development",
    "id": "Mf5nv",
    "name": "JD Test App",
    "platform": "Android"
  },
  "event": {
    "id": "5PKRR2l",
    "ts": 1717030620,
    "type": "metric",
    "metric_props": {
      "new_state": "Warning",
      "old_state": "Normal",
      "value": "1.200"
    }
  },
  "links": {
    "dashboard_url": "https://dash.embrace.io/app/Mf5nv/monitors/type/history/status/5PKRR2l",
    "monitor_url": "https://dash.embrace.io/app/Mf5nv/monitors/type/managed/edit/Ev626Vv"
  },
  "ts": 1717030759
}