Custom Metrics
Embrace captures your mobile data, and aggregates it into time series data. This data is useful for monitoring the health of your system. By default, Embrace provides standard, out-of-the-box metrics by default. These can be consumed via the Metrics API or can be forwarded into your Data Destination of choice.
Custom metrics allow you to define your own time series metrics with custom labels. This feature enables you to create specific metrics that suit your unique needs, beyond the default metrics provided.
Custom vs Standard Metrics
Embrace captures mobile data with many dimensions. In order for this data to be useful as time series data, it must be
aggregated. We automatically aggregate your metrics into Prometheus style metrics
by default using some standard, common sense labels combinations. These are useful for common golden signals like app
adoption over several app versions.
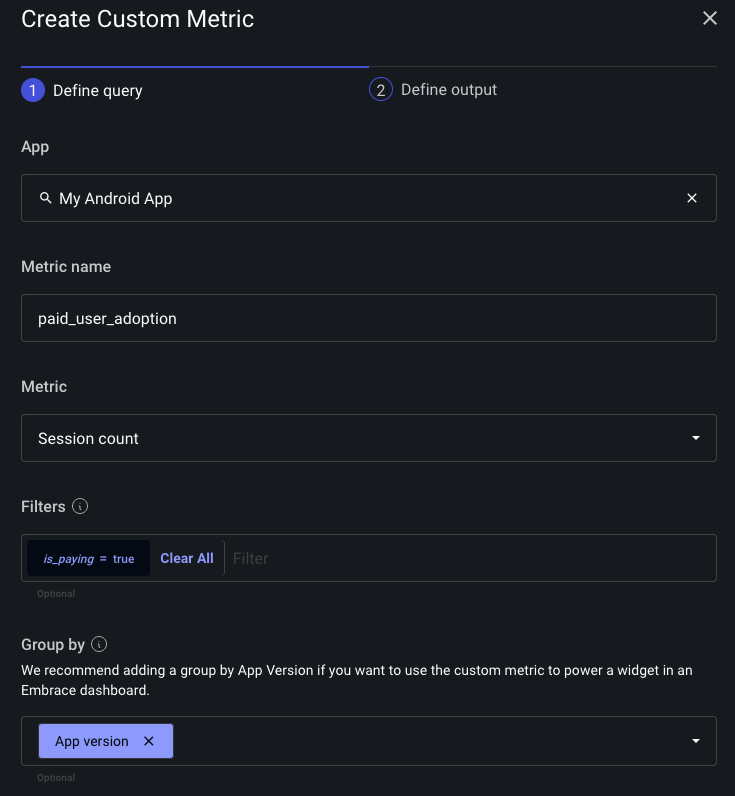
If a standard metric doesn’t suit your needs you can define a custom metric. For example, you can define a session property to identify sessions associated with paying customers and filter for that session property to get app adoption amongst paying customers. You can then consume this metric in your datastore of choice.
Creating Custom Metrics in Embrace
via Boards
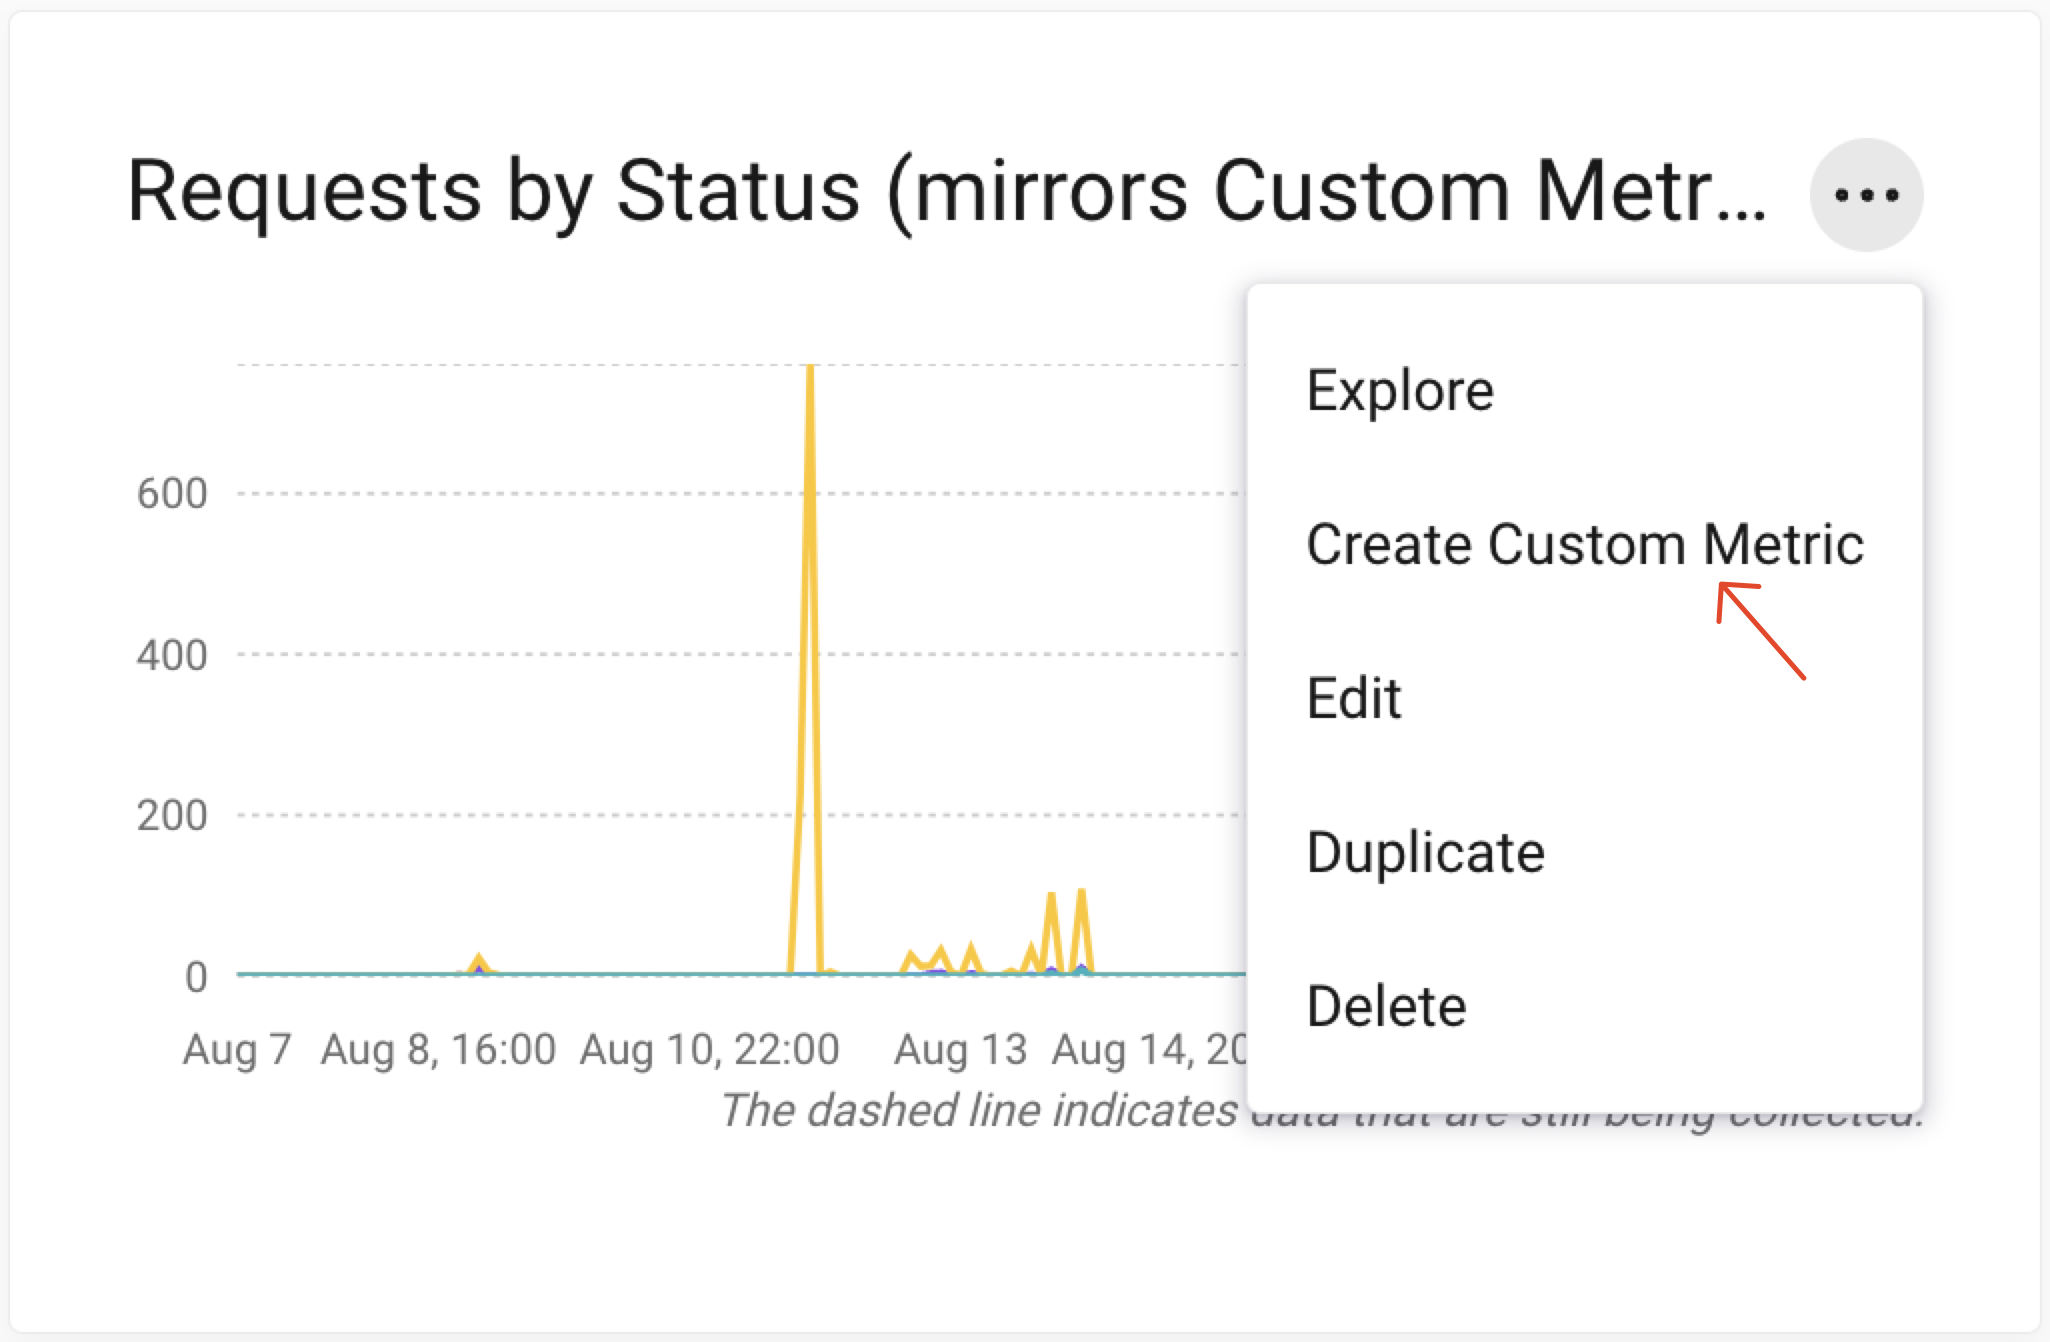
Some Widgets on custom Boards can be directly converted to Custom Metrics.
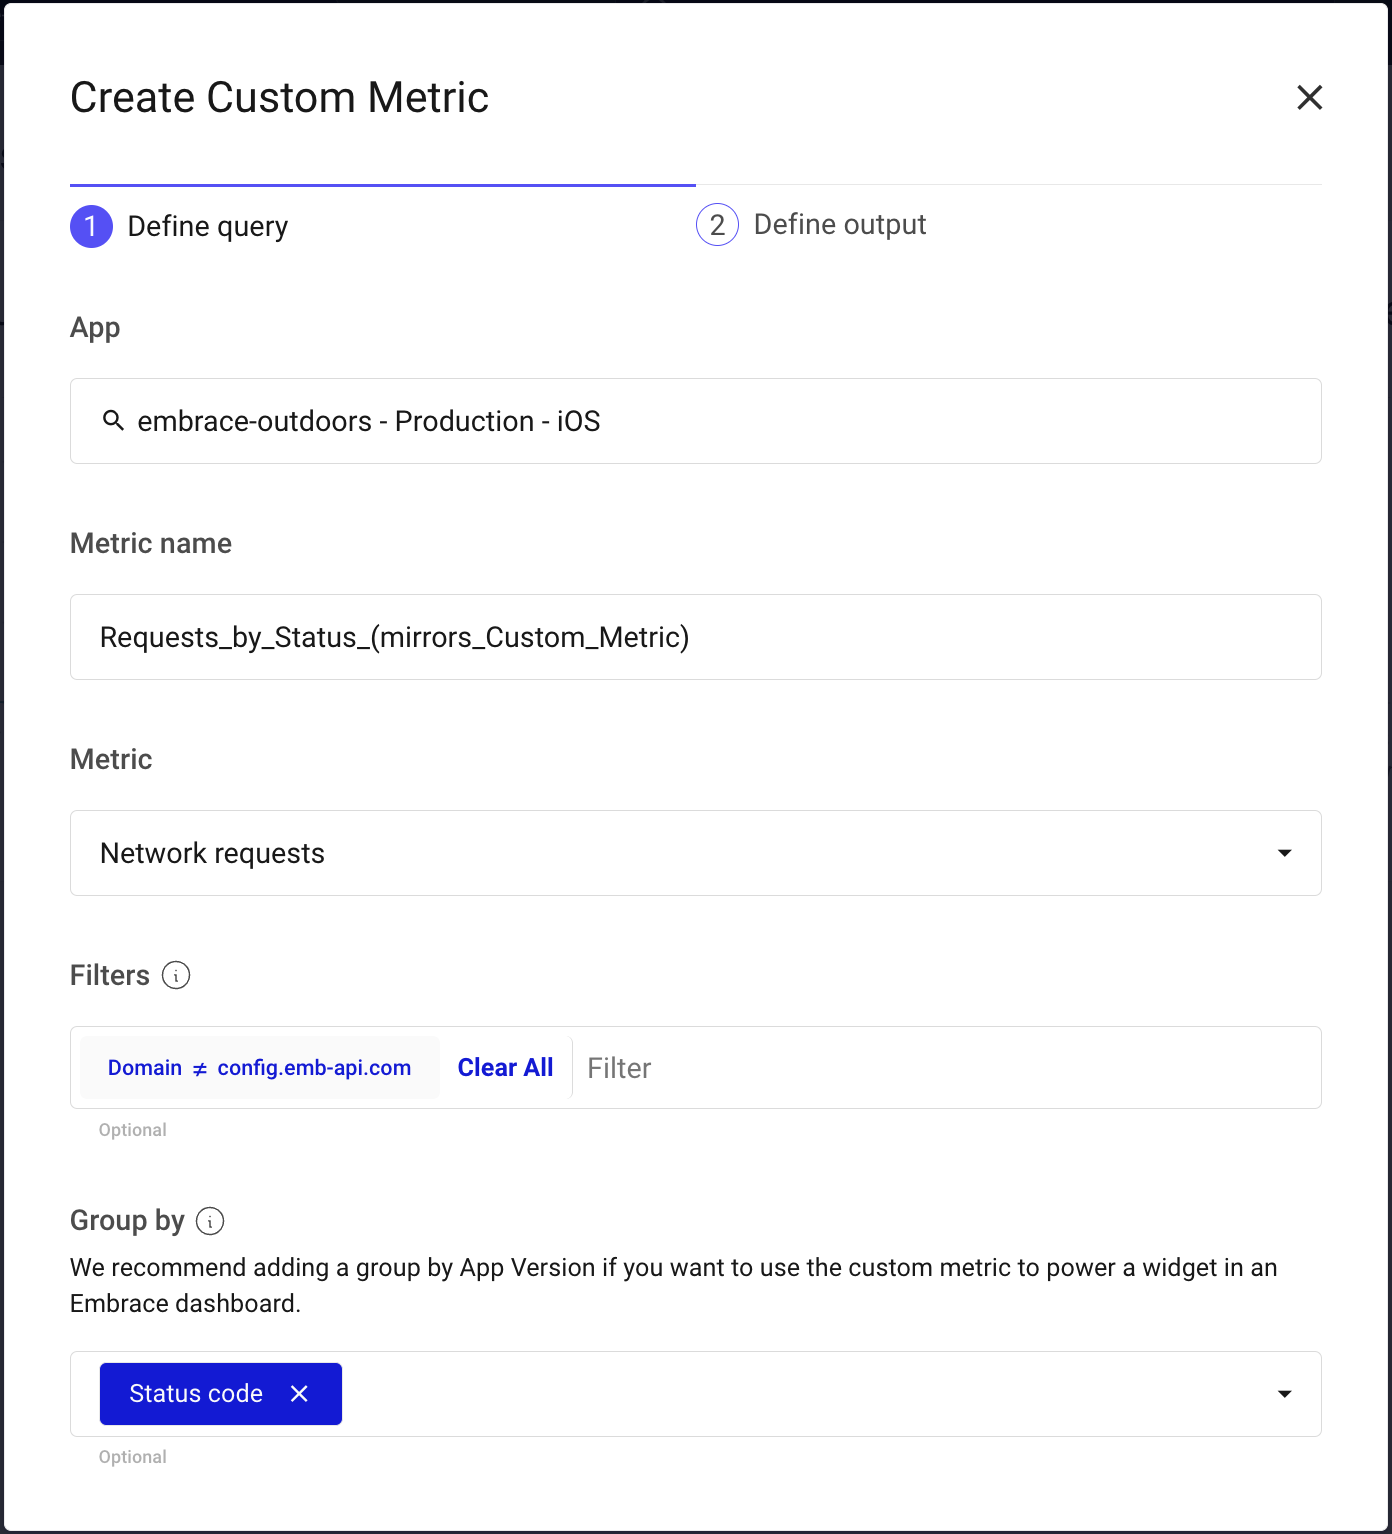
Open the menu on a Widget, and click "Create Custom Metric". This will open up a Custom Metric creation form, pre-populated with the same parameters as the Widget.


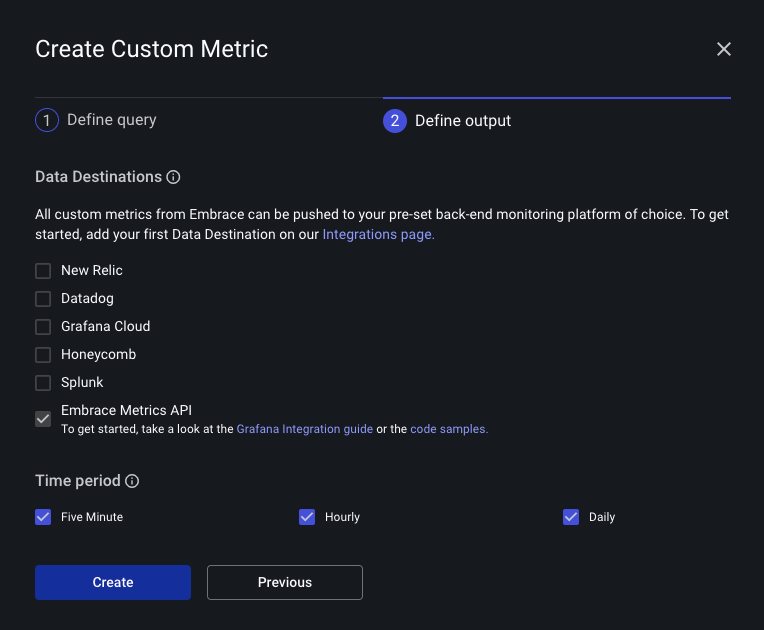
From there, follow the rest of the Custom Metric create flow by selecting a (optional) Data Destination and measurement time interval.
via Settings
Go to the Settings page in the Embrace Dashboard and click on the Custom Metrics tab. Here you can create, view, and delete custom metrics. When you define a custom metric, you can specify:
- Metric - The aggregation you want to track.
- Name - The name of the metric. Must conform to the Prometheus spec.
- Filter - (Optional) Aggregate only a subset of the data.
- Group By - (Optional) Group the data by a set of dimensions. These will become the labels in your time series data.

After defining a custom metric you must select a Data Destination. You can choose amongst our existing integrations, or you can select the Embrace Metrics API and query the data from there.
