Spans API Grafana Integration
Prerequisites
- Grafana ≥ 9.1.0
- Embrace Spans API Token. Request a token from your Embrace account manager.
Setting Up Embrace as a Data Source to retrieve spans
Follow these steps to add Tempo as a data source in the Grafana dashboard:
- Click the "Open Menu" icon to go to the "Connections -> Data sources" page.
- Click the "Add new data source" button on the top right page and select "Tempo".
- Configure it with the following fields:
- Name:
embrace-spans-api. - Under "Connection" section, set "URL":
https://api.embrace.io/spans. - Under "Authentication" section, click the button "Add header":
- Header:
Authorization, Value:Bearer <YOUR_API_TOKEN>as your token string. For example, if your API token ise2d75f07a40843f0b8a53d1e3201edba, your token string should beBearer e2d75f07a40843f0b8a53d1e3201edba.
- Header:
- Name:
Exploring Spans Data
If you click on the "Explore" tab on Grafana's sidebar, and you select the "embrace-spans-api" data source, you can start querying your spans data. There are two modes you can do queries, the "Search" mode and the "TraceQL" mode.
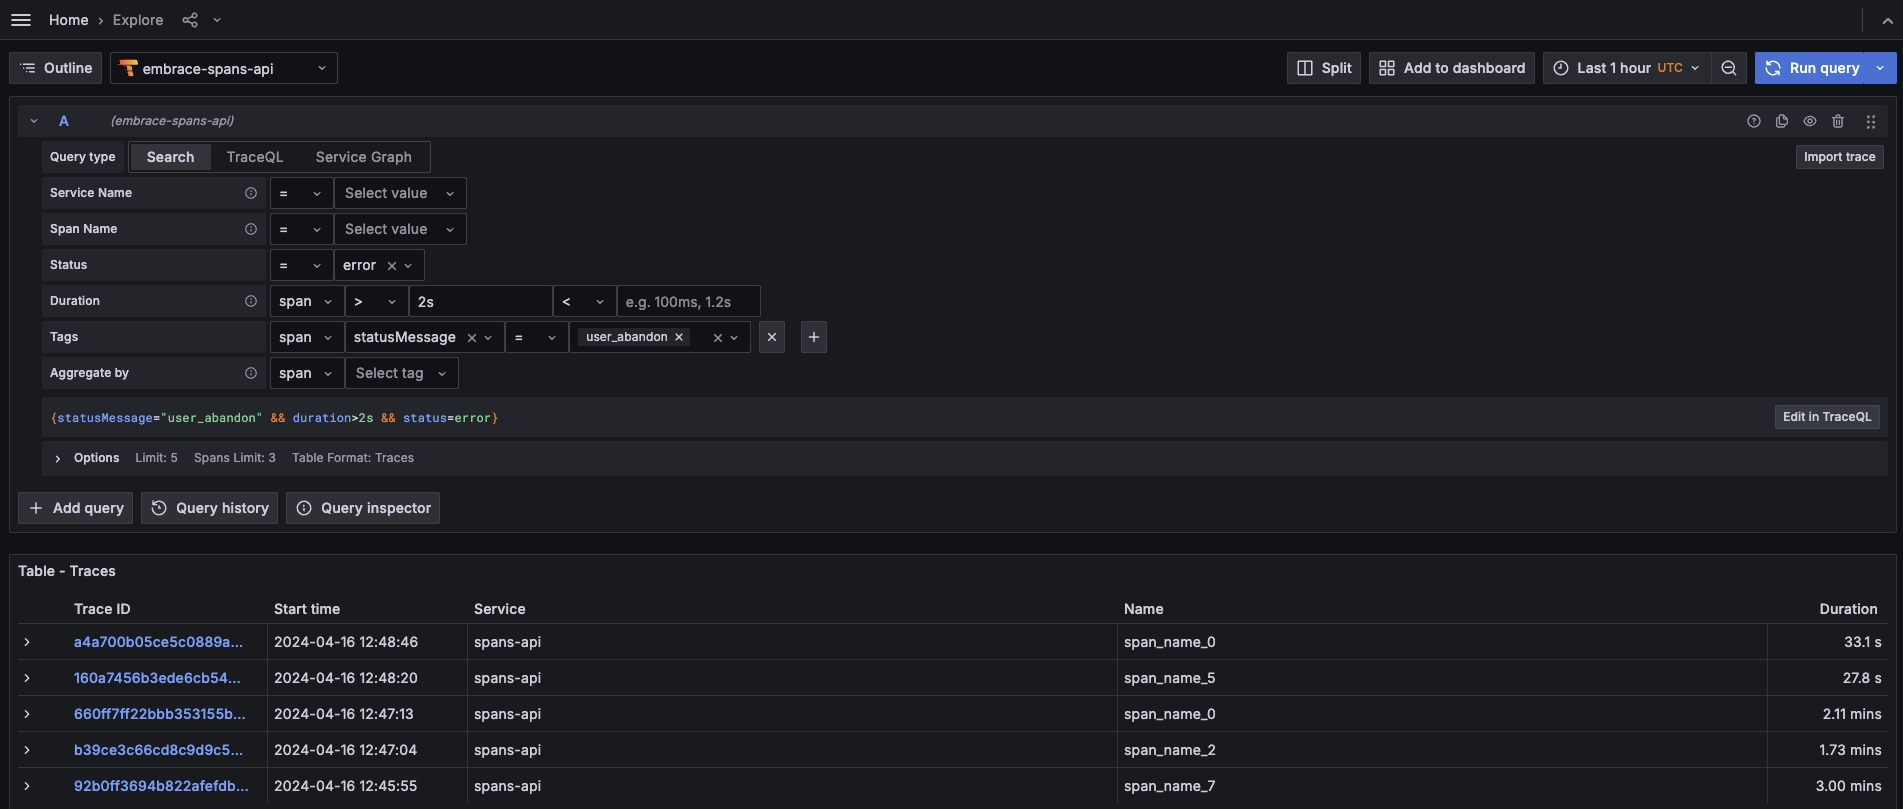
Search Mode
Here you can use the status dropdown to search for successful or error spans.
You can also search using the tags, for example, using the statusMessage tag.
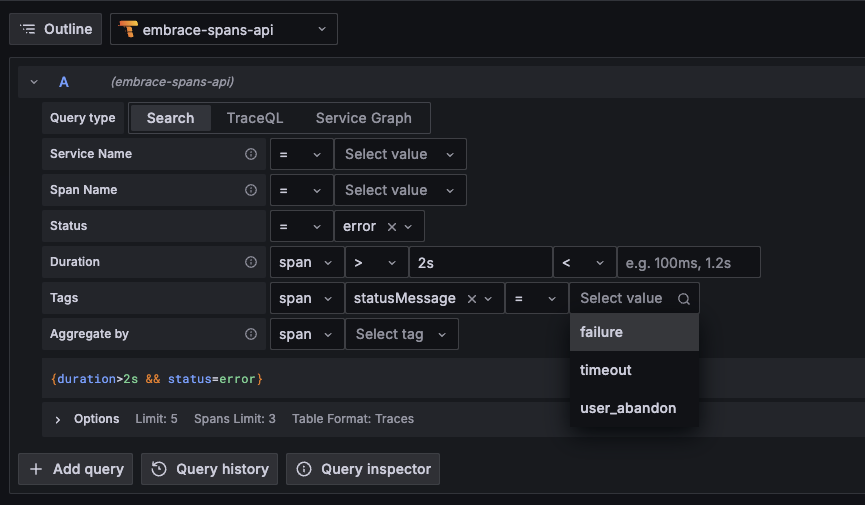
On the Tags dropdown you will be able to select any attribute that is present in your spans data
(see the Embrace attributes section).
One thing to note is that if you select an existing tag, you will be able to see the tag values that are present in your data:
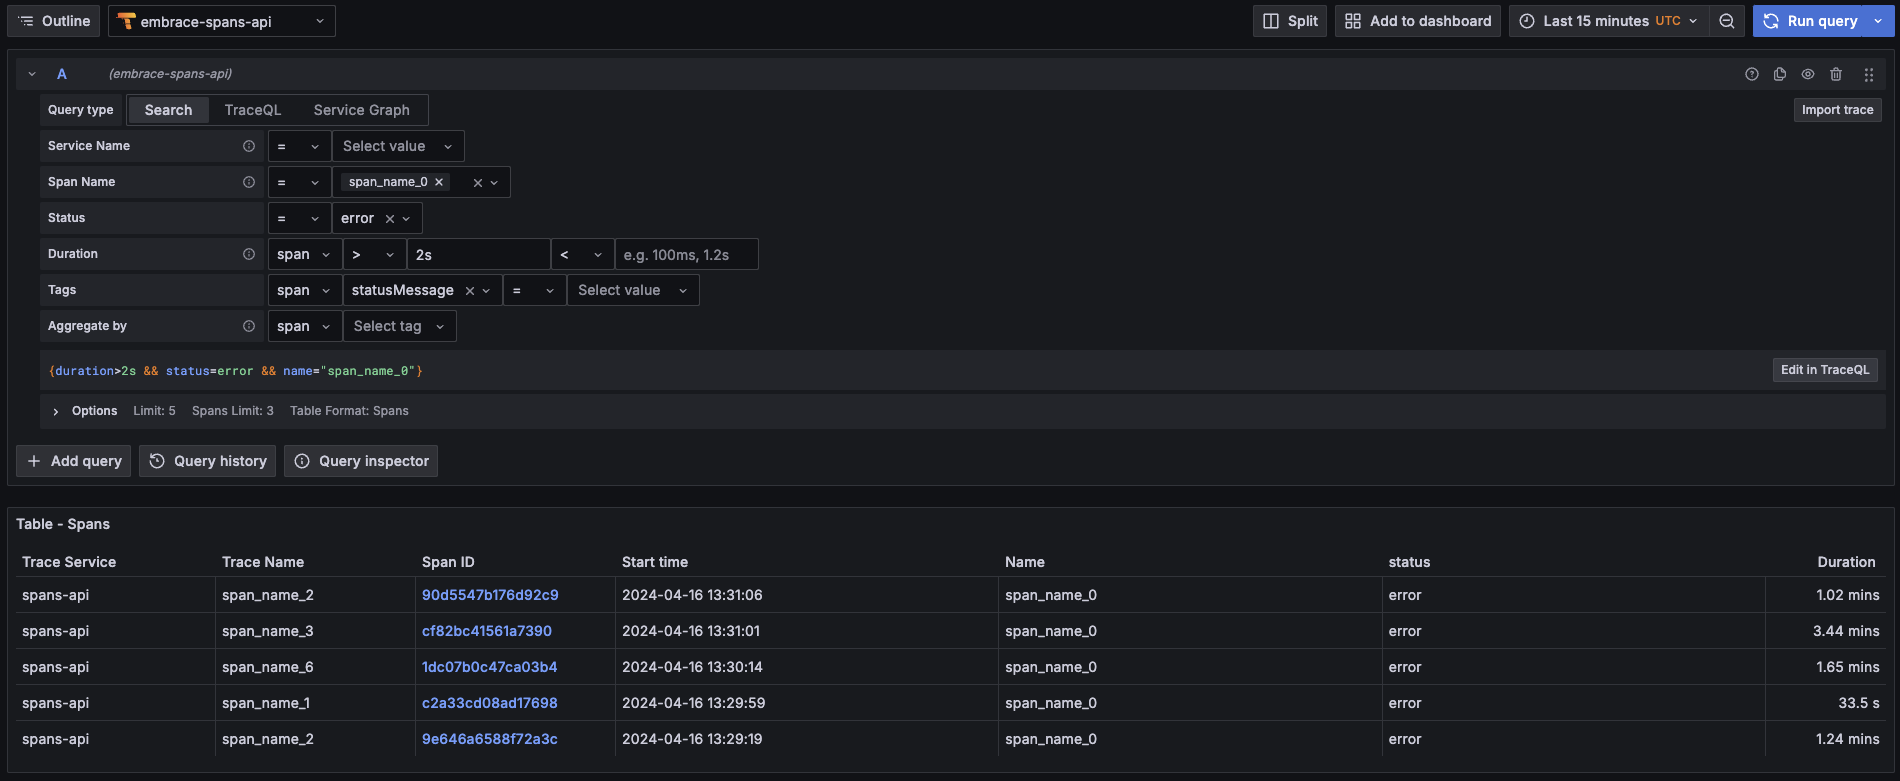
Another filter you can use is the Span name:
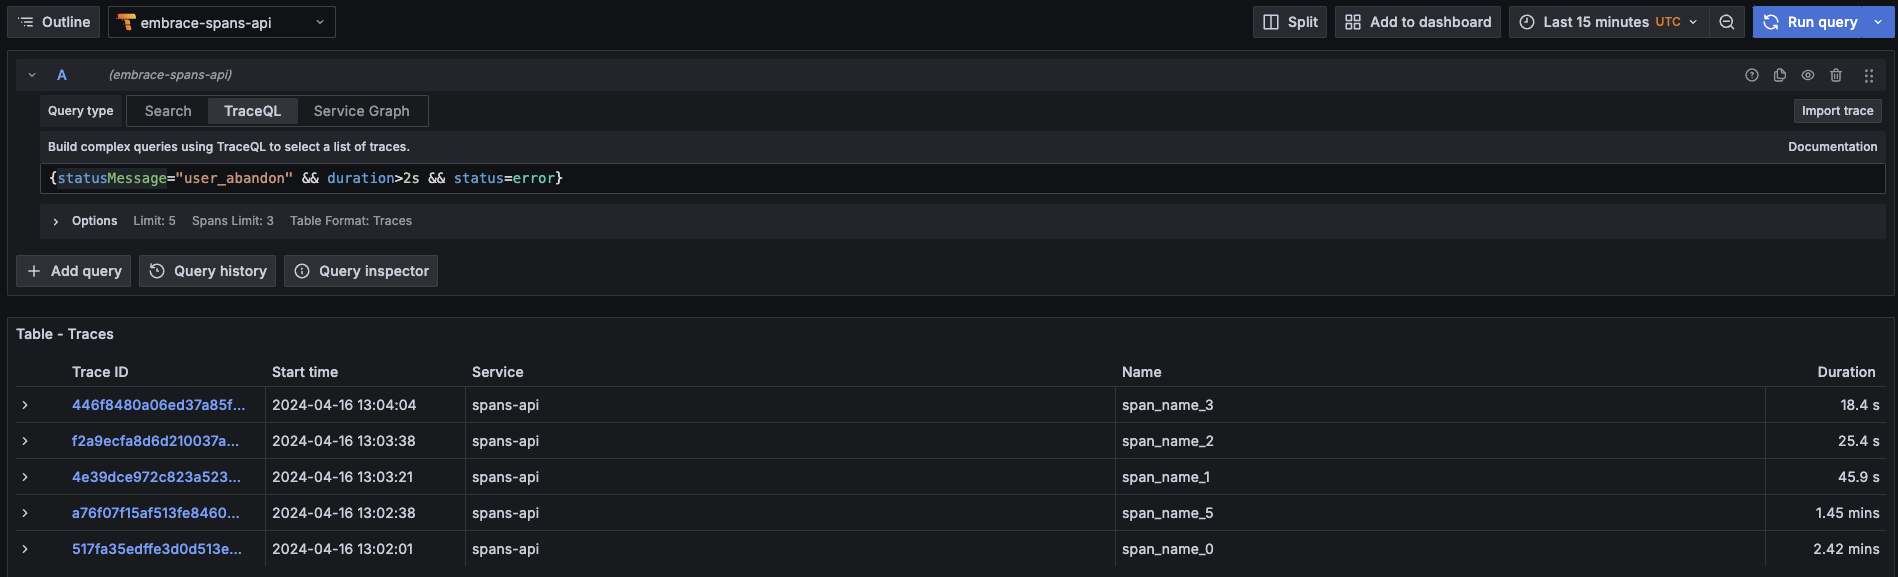
TraceQL Mode
You can also search for spans using TraceQL language.