Unity Memory Pressure Auto-Instrumentation
Overview
The Unity SDK provides a simple system for capturing memory pressure statistics from the device at runtime.
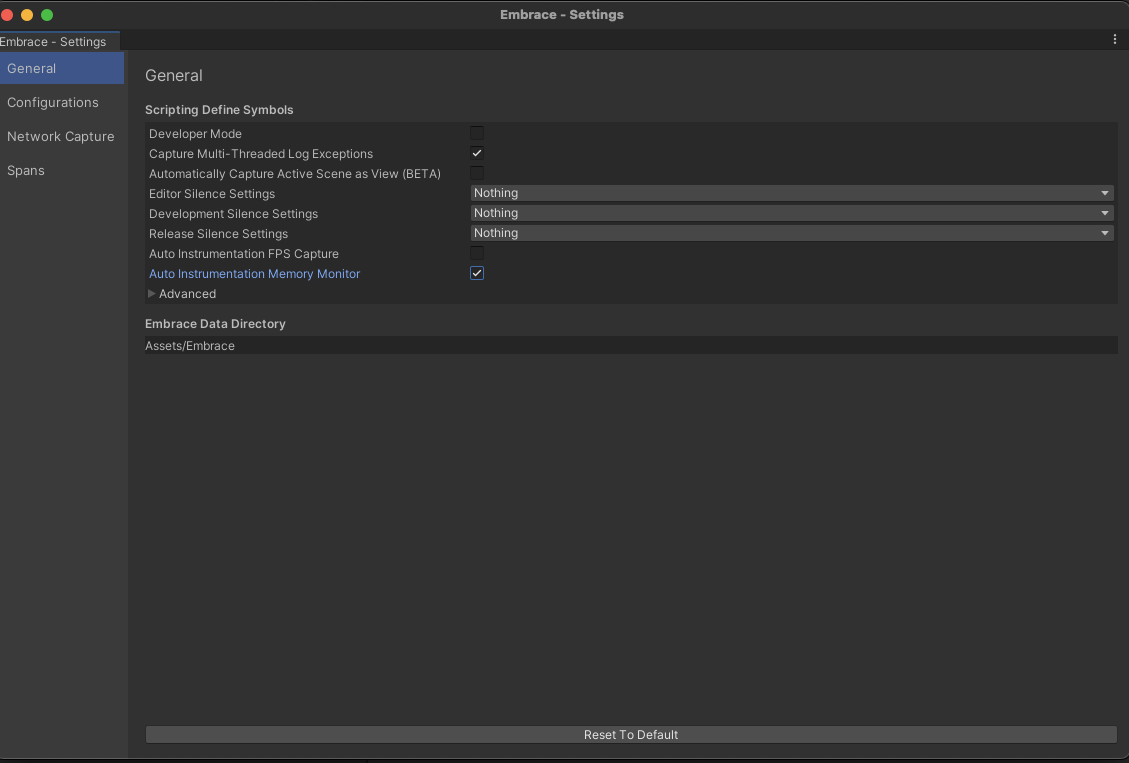
To enable, simply hit the checkbox for Auto Instrumentation Memory Monitor in your Unity SDK Settings Menu in Unity under Scripting Define Symbols.
After hitting the checkbox, the object will be automatically generated at runtime. If you need to customize your thresholds to better fit your application (recommended), feel free to do by creating a child of our provided prefab. Otherwise, we provide reasonable defaults for a wide array of applications.
What about the overhead?
There's very little to worry about. The Unity Engine is already tracking these statistics via the Profiler Recorder API. There is a certain amount of overhead, but overall you're already paying most of the cost for this in any app already as we only tap into the active markers provided by Unity for this feature. As a result, you can think of this as a lightweight instrumentation feature.