Introduction
Metrics Forwarding
Metrics Forwarding enables you to send aggregated performance metrics from Embrace to your observability platform. Instead of viewing metrics only in the Embrace dashboard, you can forward them to tools like Grafana Cloud, Datadog, New Relic, or any other platform that supports time-series metrics.
This allows you to:
- Combine mobile and backend metrics in unified dashboards
- Use your existing alerting systems for mobile app performance
- Build custom visualizations with your preferred tools
- Correlate mobile metrics with infrastructure and backend metrics
Standard Metrics vs Custom Metrics
Embrace captures mobile data with many dimensions. In order for this data to be useful as time series data, it must be aggregated. We automatically aggregate your metrics into Prometheus style metrics by default using some standard, common sense labels combinations. These are useful for common golden signals like app adoption over several app versions.
If a standard metric doesn’t suit your needs you can define a custom metric. For example, you can define a session property to identify sessions associated with paying customers and filter for that session property to get app adoption amongst paying customers. You can then consume this metric in your data destination of choice.
Get Started
- Navigate to Settings -> Integrations -> Data Destinations in the Embrace dashboard.
- Select and configure your preferred data destination.
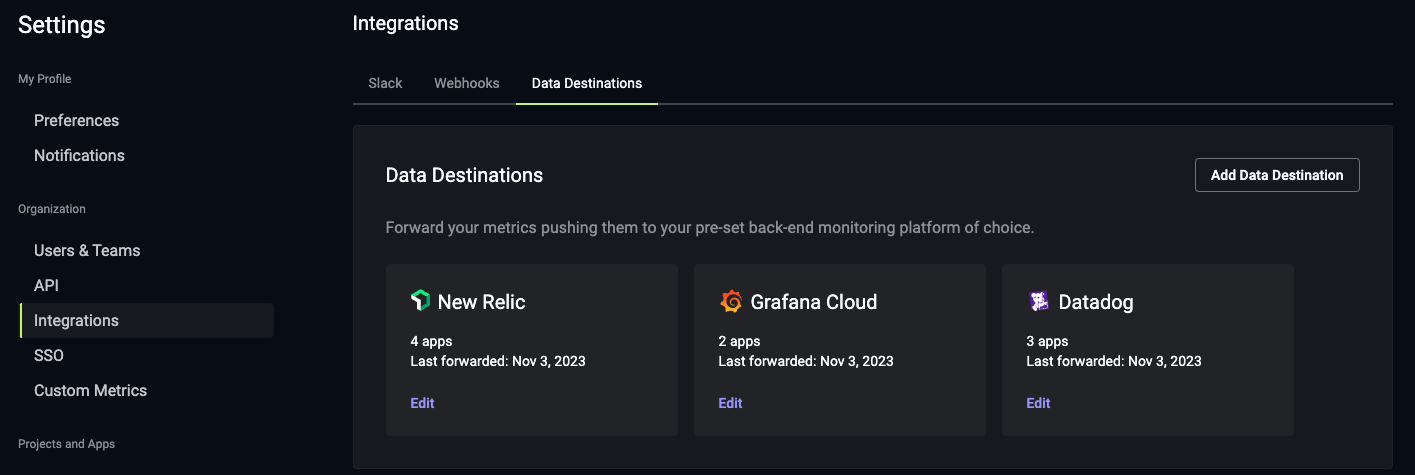
- Click "Forward all my Standard metrics to this new data destination." to receive the Standard Metrics.
- Click "Allow forwarding all of my Custom metrics to this new data destination." to receive the Custom Metrics.
Supported Data Destinations
View all the observability platforms supported in the Data Destinations page.
Supported Metrics
Embrace forwards standard and custom metrics at different time granularities to help you monitor your app's health:
Standard Metrics
| Metric name | Embrace Metrics API Name | Description | Dimensions | Time granularity | Platforms |
|---|---|---|---|---|---|
| session_total | sessions_total | Number of sessions | app_version, os_version, device_model | five_minute, hourly, daily | Android, iOS, Web |
| users_total* | users_total | Number of unique users | app_version, os_version, device_model | daily | Android, iOS, Web |
| network4xx_total | network4xx_total | Number of 4xx network errors | app_version, os_version, device_model | five_minute, hourly, daily | Android, iOS, Web |
| network5xx_total | network5xx_total | Number of 5xx network errors | app_version, os_version, device_model | five_minute, hourly, daily | Android, iOS, Web |
| crash_total | crashes_total | Number of crashes | app_version, os_version, device_model | five_minute, hourly, daily | Android, iOS |
| crash_free_user_total* | crashed_free_users | Number of unique users without crashes | app_version, os_version, device_model | five_minute, hourly, daily | Android, iOS |
| exception_total | exception_total | Number of exceptions | five_minute, hourly, daily | Web | |
| web_vital_total | web_vital_total | Number of Web Vital measurements | name, rating | five_minute, hourly, daily | Web |
| web_vital_p75* | web_vital_p75 | 75th percentile value of a Web Vital | name | five_minute, hourly, daily | Web |
Metrics marked with an asterisk (*) cannot be safely re-aggregated after they are forwarded. Combining their values across time or dimensions can produce misleading results.
users_total and crash_free_user_total are gauges representing the count of distinct devices within a specific UTC day. They are not designed for cumulative aggregation across days, as doing so could result in double-counting users. This discrepancy arises from the potential overlap of users across different dimensions; for instance, users who update the app version on the same day may be present in multiple dimensions. Nevertheless, summing the users metric across dimensions can still provide an estimate of the total user counts.
web_vital_p75 is a per-vital percentile and only makes sense when grouped by name. Different Web Vitals have different units and scales, so aggregating values across vitals does not produce a meaningful result.
Custom Metrics
Refer to this documentation to know the supported custom metrics.
Metric Naming
Metric names follow different formats depending on the data destination. The table below shows the three naming conventions used:
| Data Destinations | Format | Example |
|---|---|---|
| Datadog, Elastic, Honeycomb, New Relic, Observe and Splunk | embrace.<metric_name>.<time_granularity> | embrace.crashes_total.daily |
| Chronosphere and Grafana Cloud | embrace_<metric_name>_<time_granularity> | embrace_crashes_total_daily |
| Embrace Metrics API | <time_granularity>_<metric_name> | daily_crashes_total |
Dimension reduction - "Other"
To reduce storage costs with various observability platforms (eg Datadog), Embrace Metrics examine high cardinality dimensions for consolidation.
Device Models
There are over 40,000 unique device models on the Android operating system. The bottom 39,000 models account for ~30% of data typically. Aside from being expensive to store this many unique values, it is also unwieldy to visualize or review!
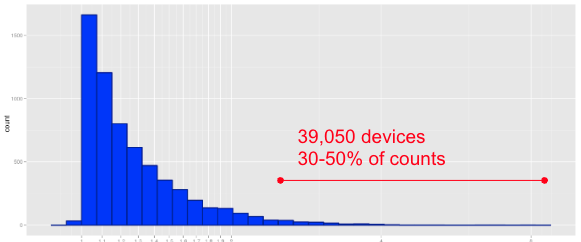
Currently, we roll together these long-tail device models into an "other" value.