Custom Metrics
Embrace captures your mobile data, and aggregates it into time series data. This data is useful for monitoring the health of your system. By default, Embrace provides standard, out-of-the-box metrics by default. These can be consumed via the Embrace Metrics API or can be forwarded into your Data Destination of choice.
Custom metrics allow you to define your own time series metrics with custom labels. This feature enables you to create specific metrics that suit your unique needs, beyond the default metrics provided.
Data Timing and Discrepancies
Custom metrics data may differ from dashboard data. Custom metrics are computed at the end of each time window and do not include late-arriving data.
Mobile data presents a unique challenge: it can be delayed due to factors such as offline devices, intermittent internet connectivity, or other disruptions. Data can arrive up to 7 days after the event actually occurred.
When our system computes custom metrics, it processes data immediately after each time window closes (5 minute, hour, day). The system assumes that the available data represents the most complete and accurate snapshot at that moment. Custom metrics are calculated based on this dataset, which may exclude some delayed data that has not yet arrived.
In contrast, dashboards in the Embrace platform continuously incorporate late-arriving data as it becomes available. This means that dashboard values will update over time as more complete data arrives, while custom metric values remain fixed based on the data available when the time window closed.
This difference enables you to understand both the real-time state of your metrics and the fuller picture that becomes available as delayed data arrives. When comparing custom metrics with dashboard data, differences are expected for recent time windows, especially within the last 7 days.
Get Started
via Boards
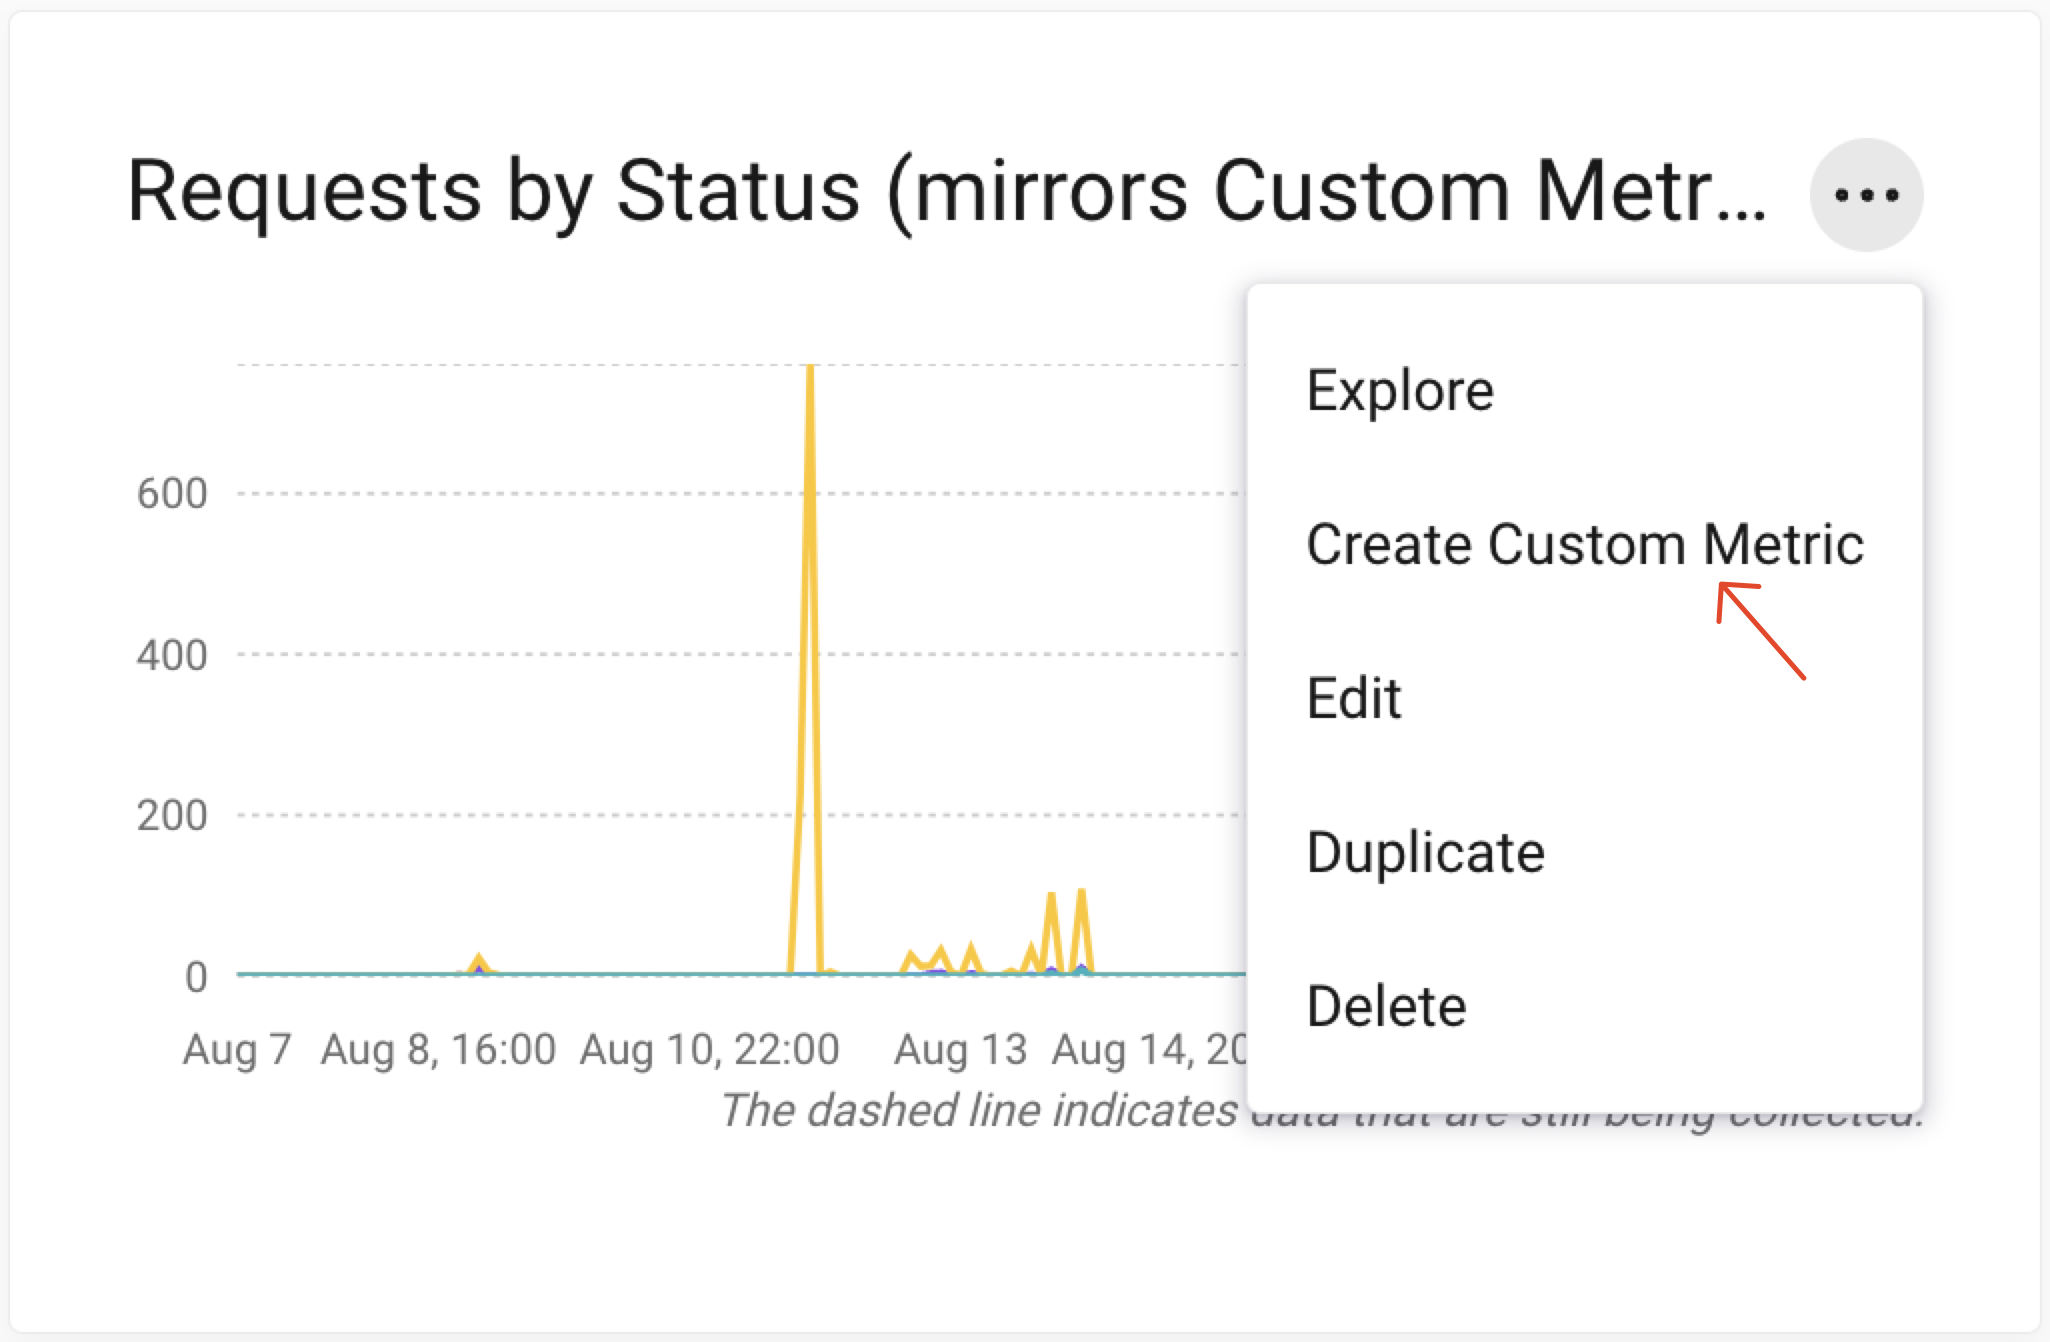
Some Widgets on custom Boards can be directly converted to Custom Metrics.
Open the menu on a Widget, and click "Create Custom Metric". This will open up a Custom Metric creation form, pre-populated with the same parameters as the Widget.
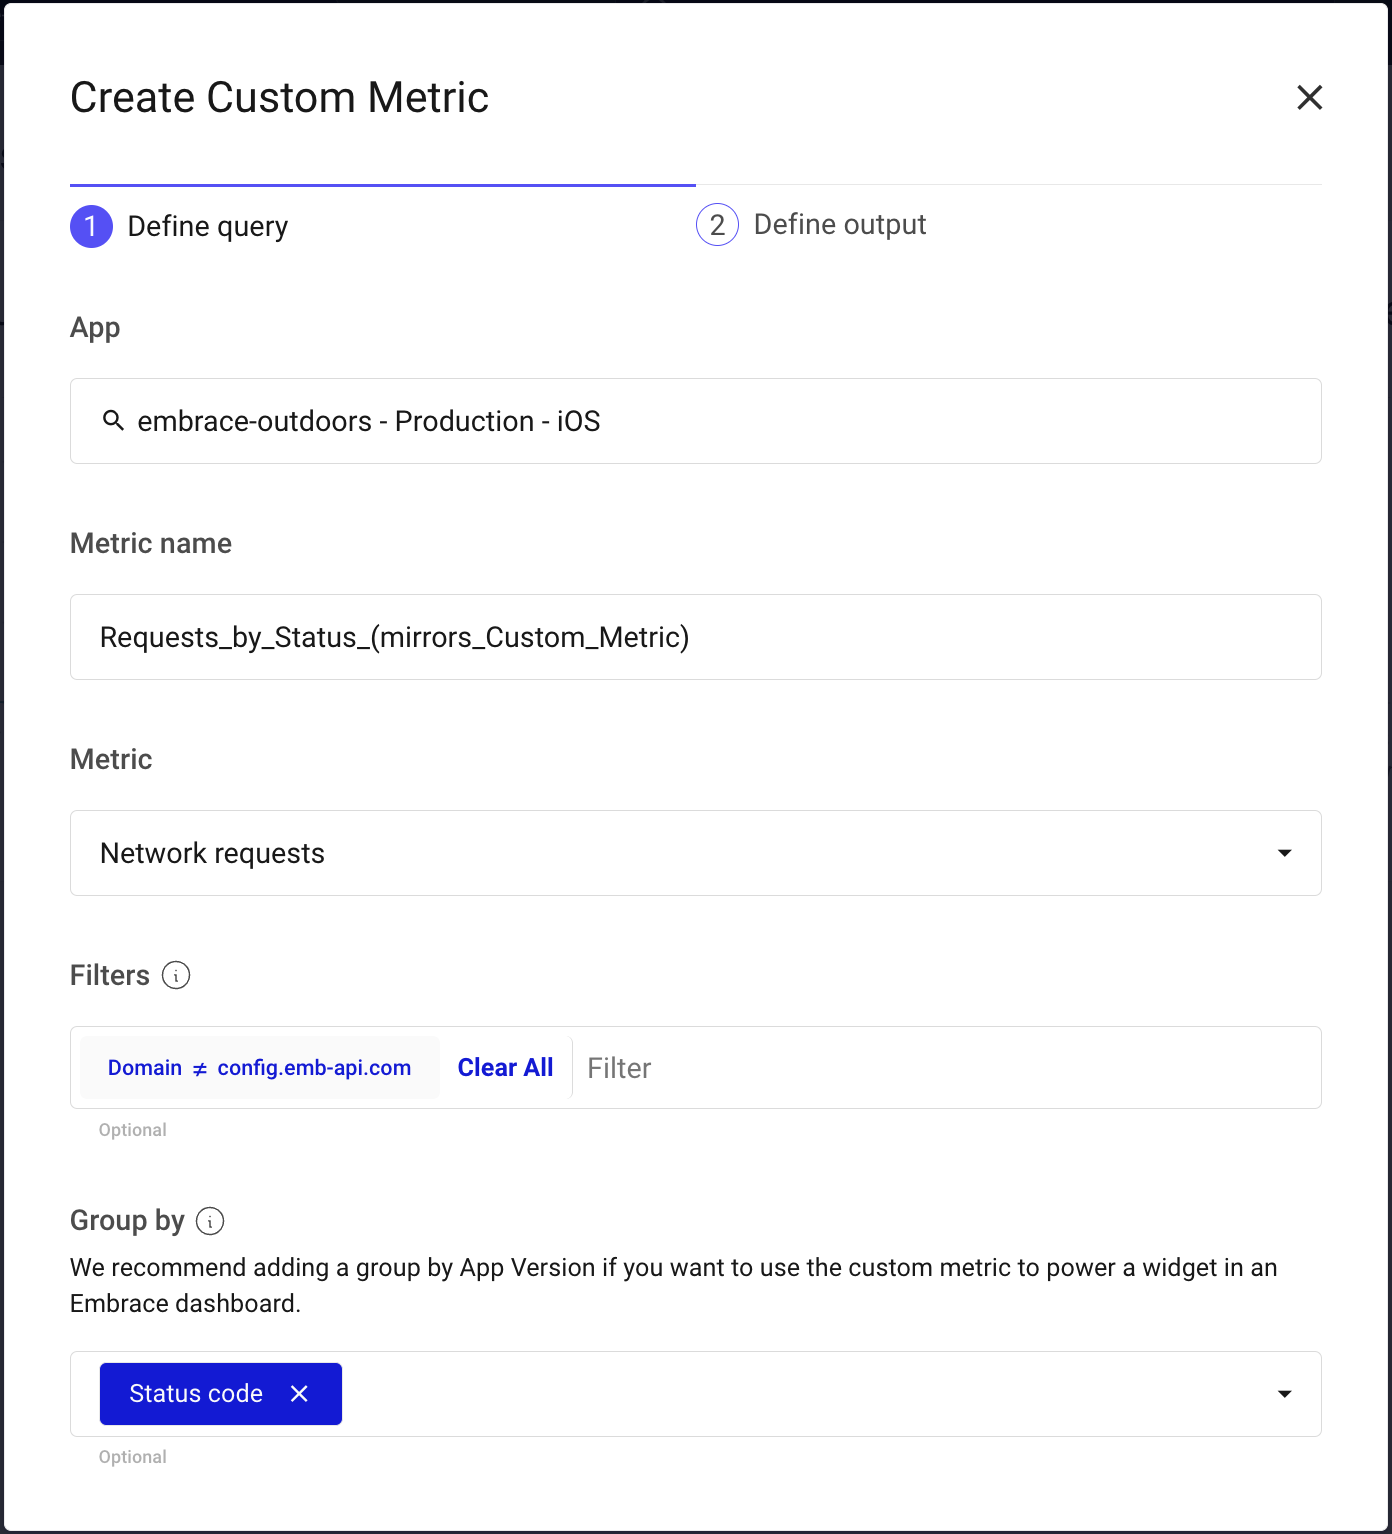
From there, follow the rest of the Custom Metric create flow by selecting a (optional) Data Destination and measurement time interval.
via Settings
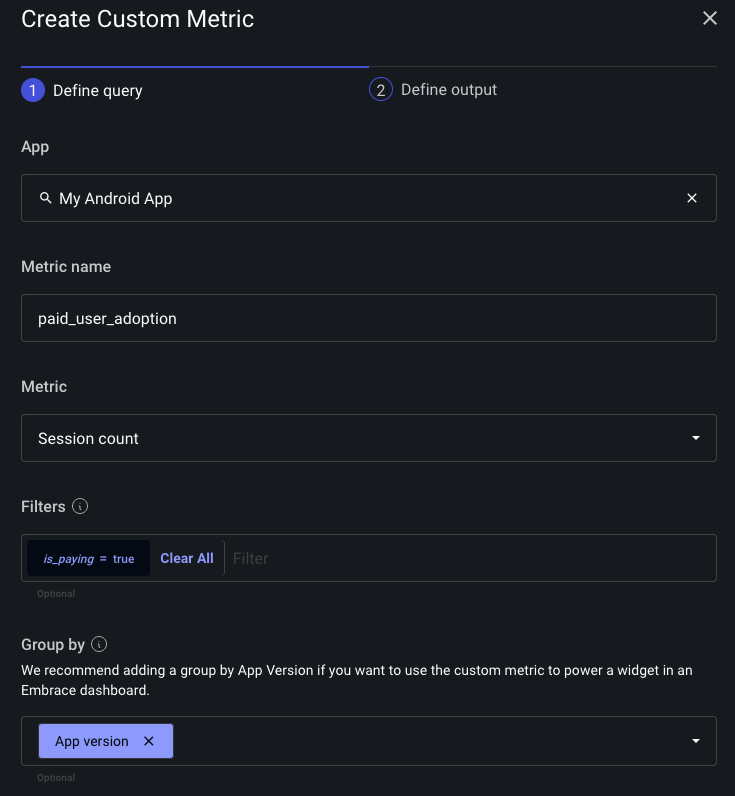
Go to the Settings page in the Embrace Dashboard and click on the Custom Metrics tab. Here you can create, view, and delete custom metrics. When you define a custom metric, you can specify:
- Metric - The aggregation you want to track.
- Name - The name of the metric. Must conform to the Prometheus spec.
- Filter - (Optional) Aggregate only a subset of the data.
- Group By - (Optional) Group the data by a set of dimensions. These will become the labels in your time series data.
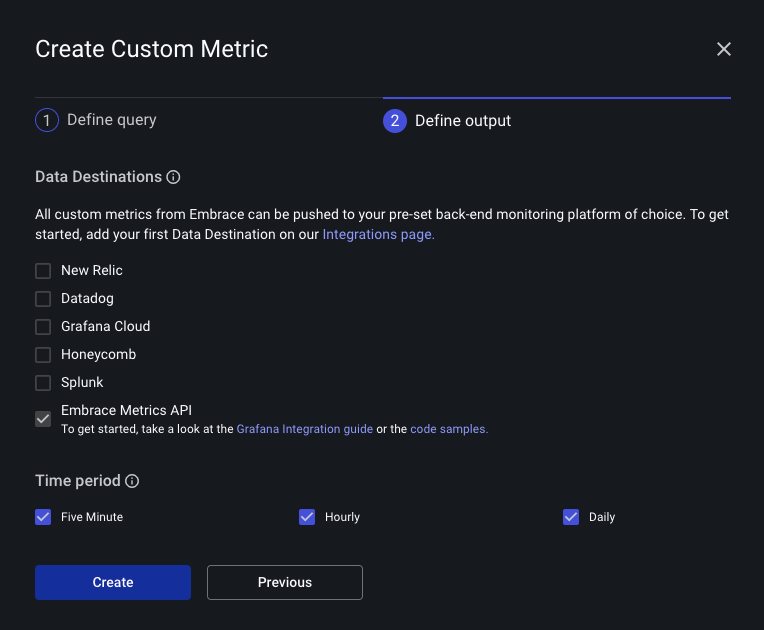
After defining a custom metric you must select a Data Destination and time period. You can choose amongst our existing integrations, or you can select the Embrace Metrics API and query the data from there.
via API
Refer to this to understand how to use the public API.
Supported Metrics
Global filters and global group bys are available to use on all the metrics.
- Global filters: app_version, country, model, os_major_version and os_version.
- Global group bys: app_version, country, os_major_version, os_version and top_n_market_name.
Metrics with the suffix "_total" are gauges.
| Metric | Description | Filters | Group by granularity | Time granularity |
|---|---|---|---|---|
| anrs_total | Number of anrs | method, sample_type | five_minute, hourly, daily | |
| anrs_duration_total | Sum of anrs durations | method, sample_type | five_minute, hourly, daily | |
| crashes_total | Number of crashes | msg, tag_name, tag_value, | five_minute, hourly, daily | |
| flutter_exceptions_total | Number of flutter exceptions | group_id, is_handled, msg, state | group_id, msg | five_minute, hourly, daily |
| logs_total | Number of logs | log_property_key, log_property_value, msg, type | log_property | five_minute, hourly, daily |
| moments_total | Number of moments | duration_bucket, moment_property_key, moment_property_value, name | duration_bucket, moment_property_value | five_minute, hourly, daily |
| network_requests_successful_duration_total | Sum of successful network requests durations | domain, method, path | top_n_domain, top_n_path | hourly, daily |
| network_requests_successful_total | Number of successful network requests | domain, duration_bucket (note: currently we do not support duration, only buckets as described in our documentation), method, path | top_n_domain, top_n_path | hourly, daily |
| network_requests_total | Number of network requests | domain, method, path, status_code | status_code, top_n_domain, top_n_path | five_minute, hourly, daily |
| sessions_total | Number of sessions | has_anr, session_property_key, sessions_property_value | session_property | five_minute, hourly, daily |
| sessions_duration_total | Sum of sessions durations | has_anr, session_property_key, sessions_property_value | session_property | five_minute, hourly, daily |
| root_spans_total | Number of root spans | root_span_attribute_key, root_span_attribute_value, root_span_duration_bucket, root_span_name, root_span_outcome | root_span_attribute, root_span_duration_bucket, root_span_name, root_span_outcome | five_minute, hourly, daily |
| root_spans_duration_total | Sum of root spans duration | root_span_attribute_key, root_span_attribute_value, root_span_name, root_span_outcome | root_span_attribute, root_span_name, root_span_outcome | five_minute, hourly, daily |
| unity_exceptions_total | Number of unity exceptions | group_id, is_handled, msg, state | group_id, msg | five_minute, hourly, daily |
- Refer to this documentation to understand
how
top_ndimensions work. - You can also pull the latest set of supported metrics directly from the API.