Embrace Dashboard
The Embrace Dashboard provides real-time tools for developers to observe all user-impacting production data from their apps. Developers use Embrace to solve issues, measure performance, and explore high-dimensional app scenarios.
By combining robust OpenTelemetry telemetry shapes with powerful tools for aggregation and investigation, dashboard users use Embrace to find out exactly what happened to individual users, important user cohorts, and the user population as a whole.
Overview page
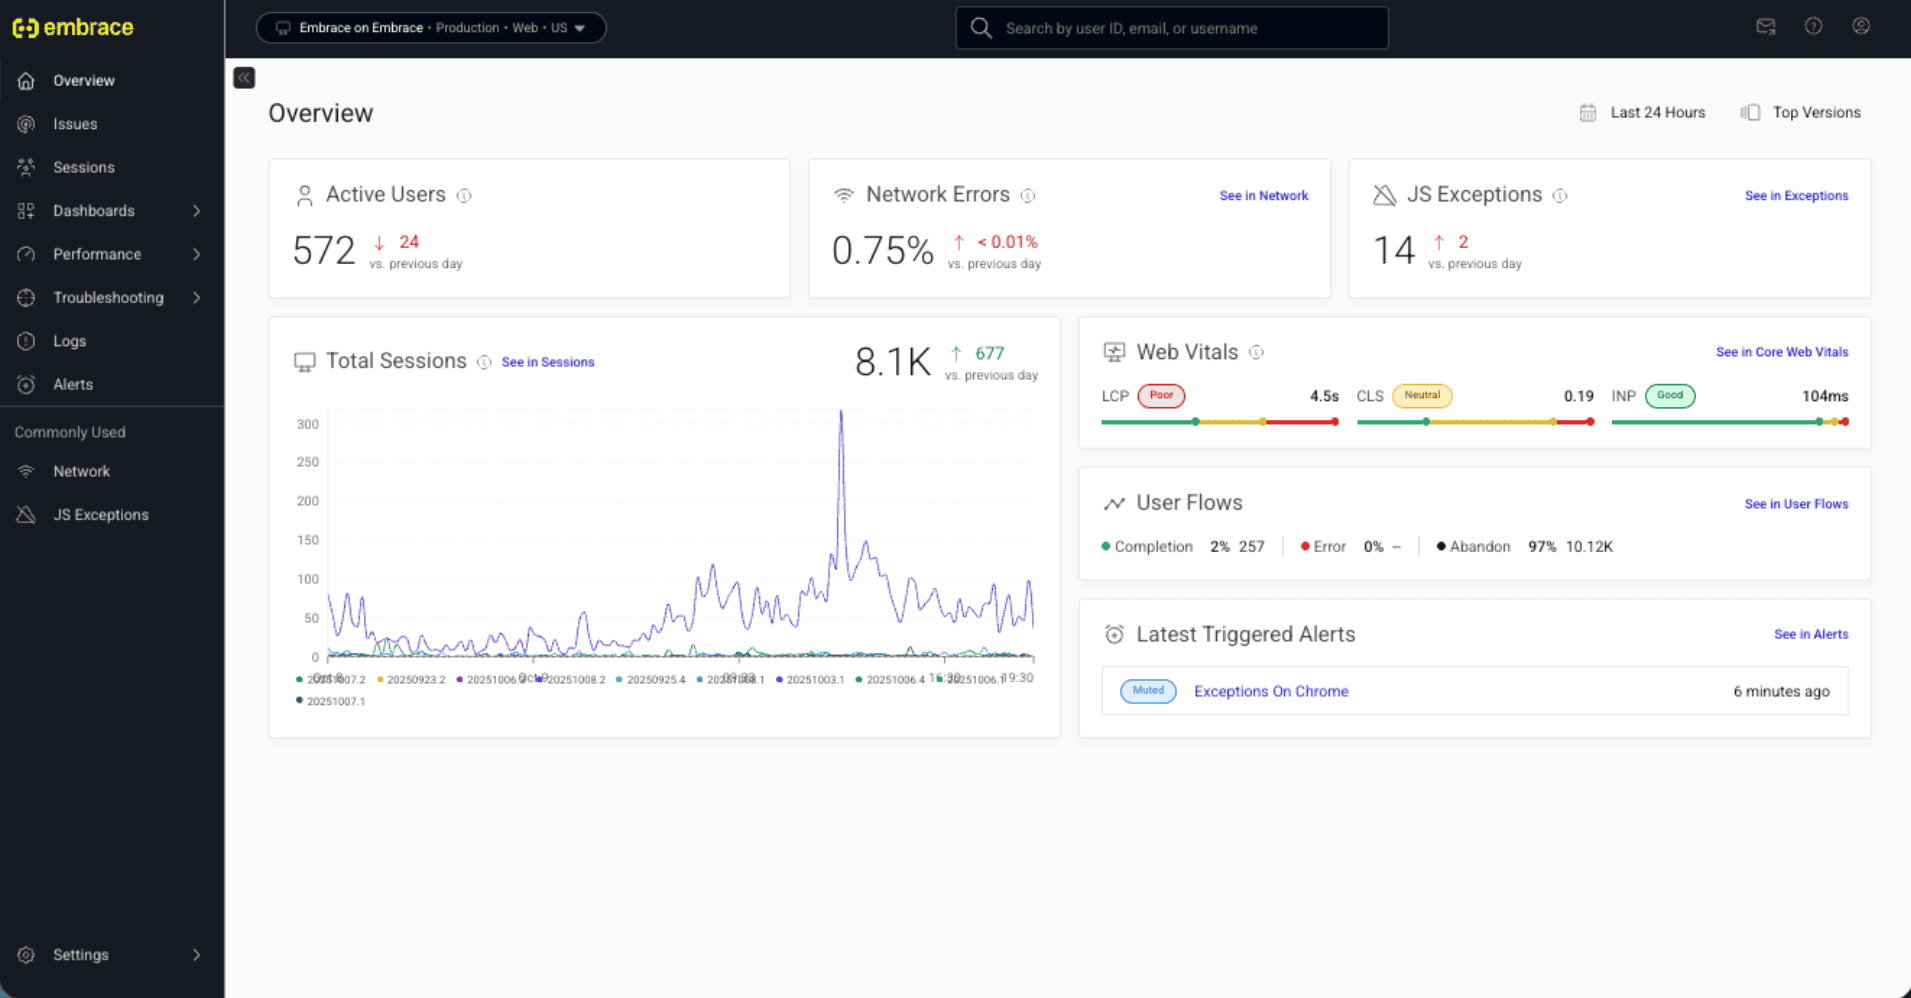
The Embrace dashboard opens to the Overview page, which is designed to give a quick, actionable glimpse into app health and the quality of your user experience. This page is the single-best starting point for digging into performance, issues, and reliability across web and mobile.
The Overview page is built on metrics for a given time period (configurable on the page), all of which is generated from production telemetry. For all Embrace apps, the Overview page shows:
- Number of active users
- Total sessions
- Network errors
- User Flow statuses
- Any triggered alerts
Additionally, for mobile apps, the Overview page will display Crash-free Session and Crash-free Users percentages, as well as App Launch metrics.
For web apps, the Overview page will display Core Web Vitals scores and JavaScript Exceptions percentages.
Dashboard features
Embrace's dashboard features provide a rich view of mobile and web telemetry in every user session. Developers can draw insights by digging in to these features to find the needle in a haystack or by manipulating the entire dataset to find out about the success or impact of experiments.
These features include:
- Issues: Spot user issues as they happen.
- User Sessions: Dig into the details of every user session.
- Dashboards: Build rich representations of the technical details in your apps.
- Traces: Trace the key flows for every user's journey.