Release Health
Release Health
The Release Health section is designed to help teams monitor and compare the quality of two different app versions over customizable time windows. It enables data-driven decisions during rollouts and helps you catch regressions early by surfacing critical metrics related to app stability and user experience.
Whether you're preparing a new release, analyzing a canary rollout, or comparing production versions, Release Health gives you both high-level indicators and granular breakdowns of app issues.
What You Can Track
Release Health currently supports insights into the following issue types:
- Crashes
- ANRs
- Exceptions
- Error Logs
- Slow Spans
For each issue type, we provide:
- Overall Impact Metrics:
- % of affected users
- % of affected session parts
- Detailed Breakdown:
- Impact per issue type
- Comparison delta between selected versions
All metrics are computed as a comparison between two groups:
- Group A (New Release) – the app version you're evaluating
- Group B (Baseline) – the reference version you're comparing against
How to use
Set Filters
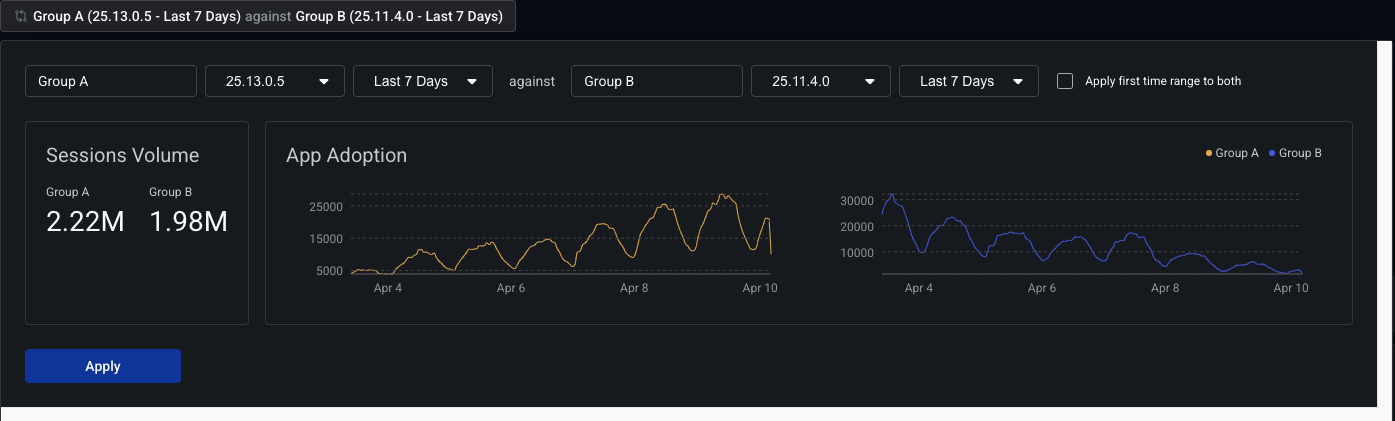
Select the app version and evaluation period for both Group A and Group B.
A preview panel will display:
- Session Part Volume
- App Adoption (within the selected time window)
These help you evaluate whether the comparison is statistically meaningful.
Once you're satisfied with your selection, click Apply to load the metrics.
💡 You can rename the group labels to something meaningful to your app or context.
Visualize Overall Metrics
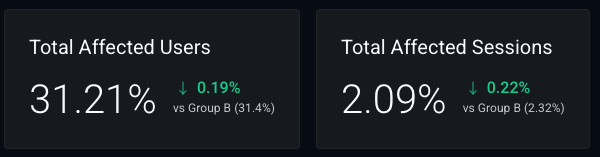
- Total Affected Users – percentage of users affected by any issue type, with comparison against Group B
- Total Affected Session Parts – percentage of session parts affected by any issue type, with comparison against Group B
Visualize Issue-Specific Metrics
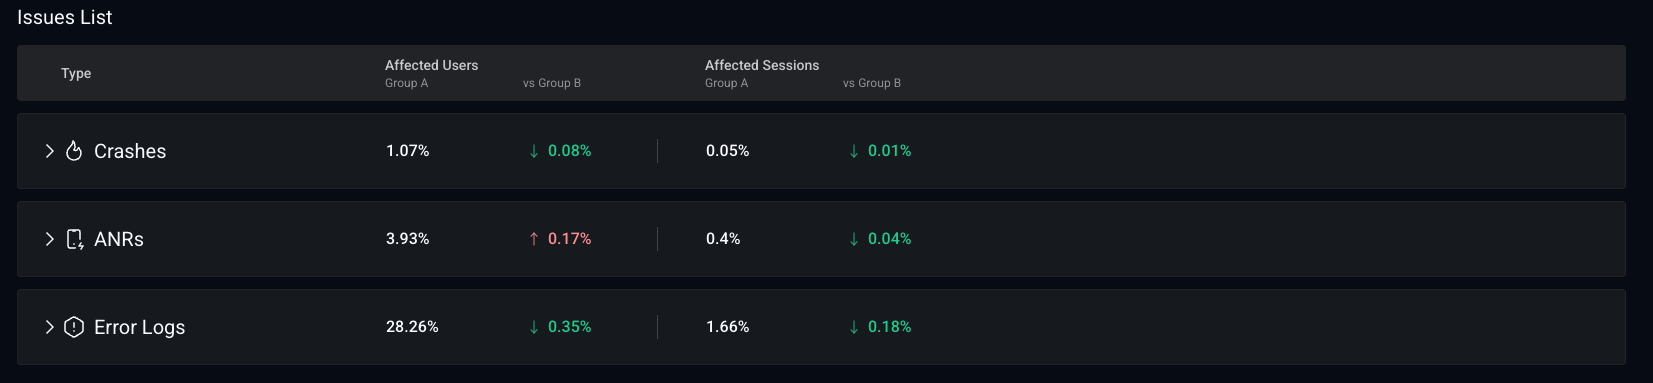
- Affected Users per Issue – percentage of users impacted by a specific issue type (Crashes, ANRs, etc.), compared to Group B
- Affected Session Parts per Issue – percentage of session parts impacted by a specific issue type, compared to Group B
Detailed Comparison
A detailed table listing each individual issue (e.g., specific crash or exception), with impact metrics across both groups. This helps you:
- Identify new or regressed issues in Group A
- Quantify the impact of each issue type
- Prioritize based on user/session impact delta between versions