User Journeys
With Embrace’s User Journeys feature, you can move beyond simple funnel analysis and gain deeper insights into how users experience your application. User Journeys allow engineering teams to track and analyze all the events in a journey that a user takes, providing valuable data on performance impacts and behavioral trends.
User Flows
User Flows are a powerful way to understand the sequence of events that users experience within your app. They’re created by defining the connection between two specific telemetry events, allowing you to track key performance elements between actions. Think about User Flows as the first order logical grouping of all the base telemetry events you can emit into a contextualized view of a user's experience.
You can find User Flows under the Performance tab in the sidebar on the left of your dashboard. Here is a brief walkthrough video of User Flows in Embrace. Continue reading below for more details on creating and refining User Flows.
Important Considerations
-
No concurrent User Flows on the same device: On a single device, only one User Flow can be active at any given time. If a new User Flow starts while another is still in progress, the previous one is automatically terminated.
Example: Two User Flows are defined for the same app
- User Flow A: Start Event is "Span A" and End Event is "Breadcrumb A".
- User Flow B: Start Event is "Span B" and End Event is "Breadcrumb B".
Event timeline:
-
10:00 — "Span A" occurs.
-
10:01 — "Span B" occurs.
-
10:02 — "Breadcrumb A" occurs.
-
10:03 — "Breadcrumb B" occurs.
Result
-
"User Flow A" ends with the outcome Abandoned / New User Flow Started.
-
"User Flow B" ends with the outcome Complete.
- User Flows may span multiple sessions: A User Flow is not constrained to a single session. It may start in one session and complete in a later session (e.g., start in Session 1 and finish in Session 3).
Outcomes
There are different possible outcomes for a User Flow:
- Completed: The User Flow progressed from the Start Event to the End Event within the configured timeout and without exiting the app.
- Error: The User Flow started but ended in an error.
- Android/iOS: A crash occurred before the End Event.
- Web: An exception occurred before the End Event (coming soon).
- Abandoned: The User Flow started but didn't reach the End Event.
- New User Flow Started: A new Start Event occurred before the End Event.
- App Exit:
- Android/iOS: The user exited the application.
- Web: Not applicable.
- Timeout: The User Flow exceeded the configured timeout.
Start and End Events
User Flows are built using various telemetry events:
- Breadcrumbs: Track the user's navigation path.
- Logs: Detailed messages generated during user interactions.
- Network events: Capture data related to HTTP requests and responses.
- Spans: Represent a specific operation within your application.
- User Taps: See your framework-relevant Tap Capture, where supported.
- Views, Custom Views, and Web Views: See your framework-relevant documentation on Views, Custom Views, and Web Views.
Note: While Traces provide detailed performance information, User Flows offer a more focused approach by connecting events around user behavior, making them easier to interpret and use for analysis.
While instrumenting Traces can be useful in situations like this, they involve more rigid instrumentation and are more duration-focused than outcome and contributing event-focused. User Flows allow you to quickly explore, modify, and view analytics that give you insights into user behaviors based on all of the events between two points.
Creating a User Flow
To create a User Flow, you will click on the "Create User Flow" button in the top right of the page. This will take you to the User Flow creation page where you can set them up.
As an example, let's assume you have an e-commerce application. A key component of your user's experience would be searching for and rendering specific results pages. So, here you may want to set up a User Flow that starts at a Breadcrumb you already have for Entered search and finishes at the end of a Span named inflateResultsView.
To create this User Flow, you will:
- From the User Flows page, select "Create User Flow" in the upper right corner.
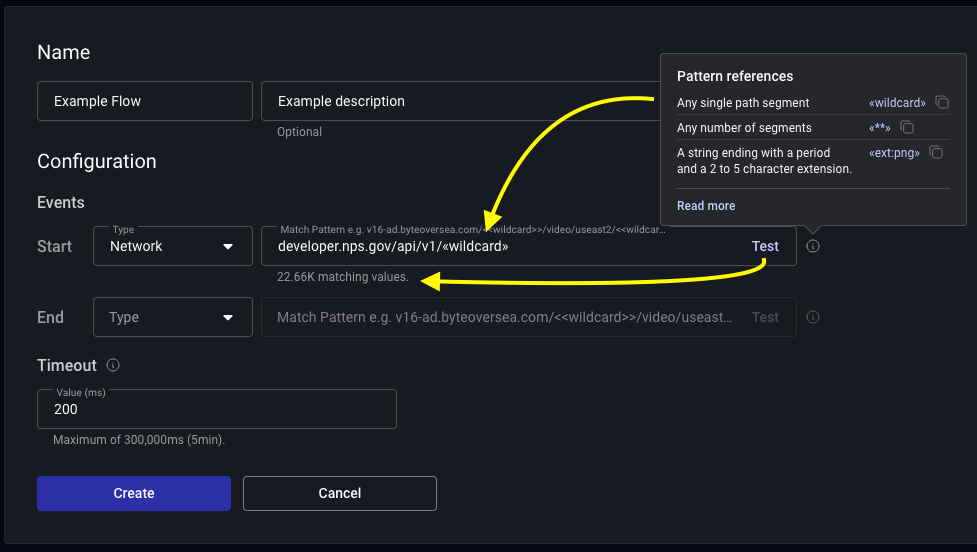
- In the Create Flow screen, fill in the details of your User Flow.
a. Give it a name (required) and a description (optional). Both of these will be visible on the summary page after you create User Flows.
b. Set your start event as Breadcrumb =Entered searchand Span =inflateResultsViewas your end event. - Set a Timeout for your User Flow.
a. We recommend keeping these as short as possible, but they must be less than 5 minutes. Time limit for completion before termination as "Abandon / Timeout".
Wildcarding patterns:
For high cardinality fields such as Breadcrumbs, Logs, Networks, and Web Views events, you can use wildcarding patterns to filter data. The "Test" button checks if your pattern matches existing data.
- Breadcrumbs, logs, network, and web views: Checks the last 1 million rows and the last 24 hours of sessions.

Note: Newly-created User Flows collect data on a going-forward basis. This means that immediately after you create a new User Flow, you may not see any data. As new sessions come in, you'll see data start to populate. Additionally, User Flows cannot be modified after being created. If you need to change them, you'll need to delete the existing User Flow and create a new one.
User Flows Summary page
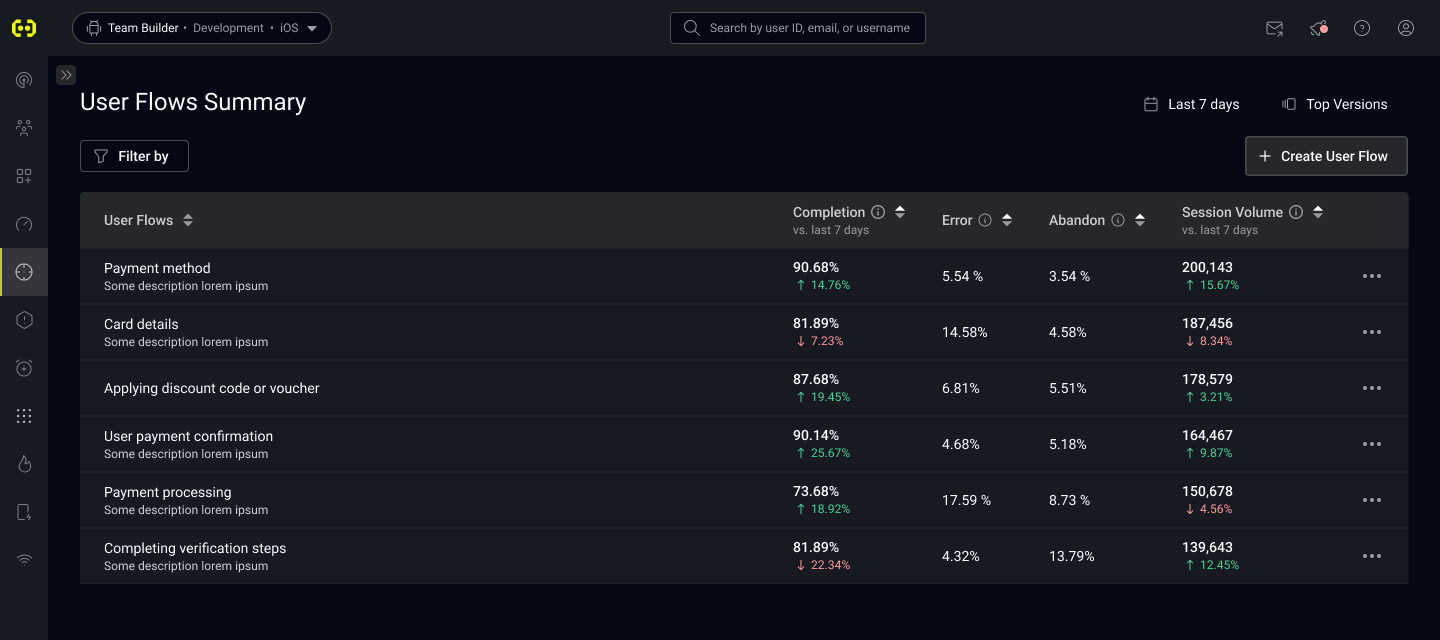
On the User Flows Summary page, you'll see a list of all of your currently-configured User Flows with some useful information.
- Completion: This is the percentage of User Flows that ended in a "Complete" outcome. This is shown in comparison across the time window you have selected.
- Error: This is the percentage of User Flows that ended in an "Error" outcome.
- Abandon: This is the percentage of User Flows that ended in an "Abandoned" outcome.
- Session Volume: This is the count of sessions that contained this User Flow. This is shown in comparison across the time window you have selected.

User Flow Details page
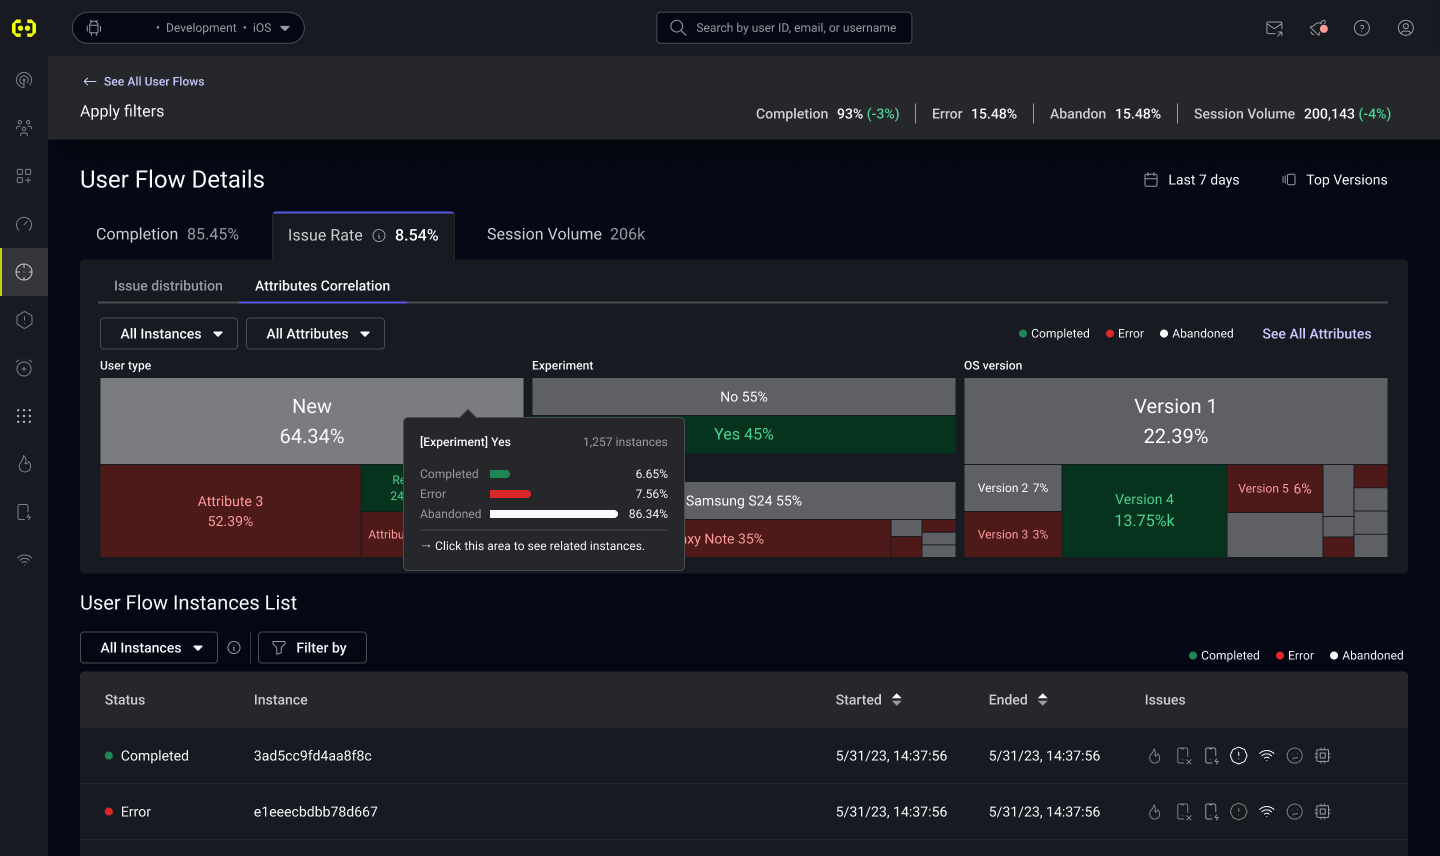
When you click on any of the User Flows you've created, you'll be taken to that User Flow's details page. Here, you'll find some helpful tools to analyze your User Flows. You can see Completion Percentage and Session Volume broken down by app version, as well as Issue Rates and Abandon Percentage which are covered in detail below.
Issue Rate
The "Issue Rate" tab contains two sub-tabs. The first is "Issue Distribution", which gives you an idea of the makeup of all Issues that are being seen during the selected User Flows in aggregate.
Issue Definitions:
- ANRs (Android)
- Crashes (Android / iOS)
- Error Logs (Android / iOS / Web)
- Network Errors (Android / iOS / Web): Any 4xx or 5xx status code or connection error
On the "Properties Correlation" sub-tab, you can dig into how certain attributes of your User Flows correlate to, and make up, outcomes. You can filter by specific outcomes, as well as select up to 3 different property keys to visualize in the treemap below. This can help you quickly find specific properties that are having outsized issues and reduce the space that you have to explore to find issues.
Hovering your mouse over the treemap, you'll see a tooltip that breaks down the distribution of User Flow outcomes for flows with that specific property value. By clicking on the cell, you'll see the instance list below filter just for that attribute so you can easily find some example sessions to dig into.

Instance List
You can find a filterable list of all instances of the User Flow at the bottom of the page. Clicking any of these instances will take you to the User Timeline for further investigation as you need it.
User Flows in Boards, Alerts, and Custom Metrics
Alerts and Custom Metrics
NOTE: User Flows are processed using data that comes in multiple payloads from the client. As such, there can be a time delay of up to 10 minutes. Due to this potential delay, we don't allow 5 minute aggregations.