Dynatrace Integration
Dynatrace integration
You can forward your Embrace metrics and network spans to Dynatrace through its OpenTelemetry (OTLP) API.
Prerequisites
- A Dynatrace SaaS environment, or an ActiveGate that is reachable from the public internet.
Configuration
To set up the integration, you need your environment URL and an access token.
Find your environment URL
Your environment URL looks like https://abc12345.live.dynatrace.com, where abc12345 is your environment ID.
On the Embrace dashboard, you can enter any of these:
- The environment ID on its own, such as
abc12345. - The URL from your browser's address bar while you're signed in to Dynatrace, such as
https://abc12345.apps.dynatrace.com. Embrace converts it to the matchingliveURL. - The environment URL, with or without
https://.
Use an https URL. Embrace doesn't accept http.
Send through an ActiveGate
If you route ingest through an ActiveGate, enter its URL in the form https://<activegate-host>/e/<environment-id>. Embrace sends data from the public internet, so the ActiveGate must accept connections from outside your network.
Create an access token (Dynatrace documentation)
You can use either a classic access token or a platform token.
To create a classic access token:
- In Dynatrace, open the Access Tokens app and select Generate new token.
- Enter a name, such as
embrace-metrics. - Search for
metrics.ingestand select the Ingest metrics scope. If you forward network spans, also search foropenTelemetryTrace.ingestand select the Ingest OpenTelemetry traces scope.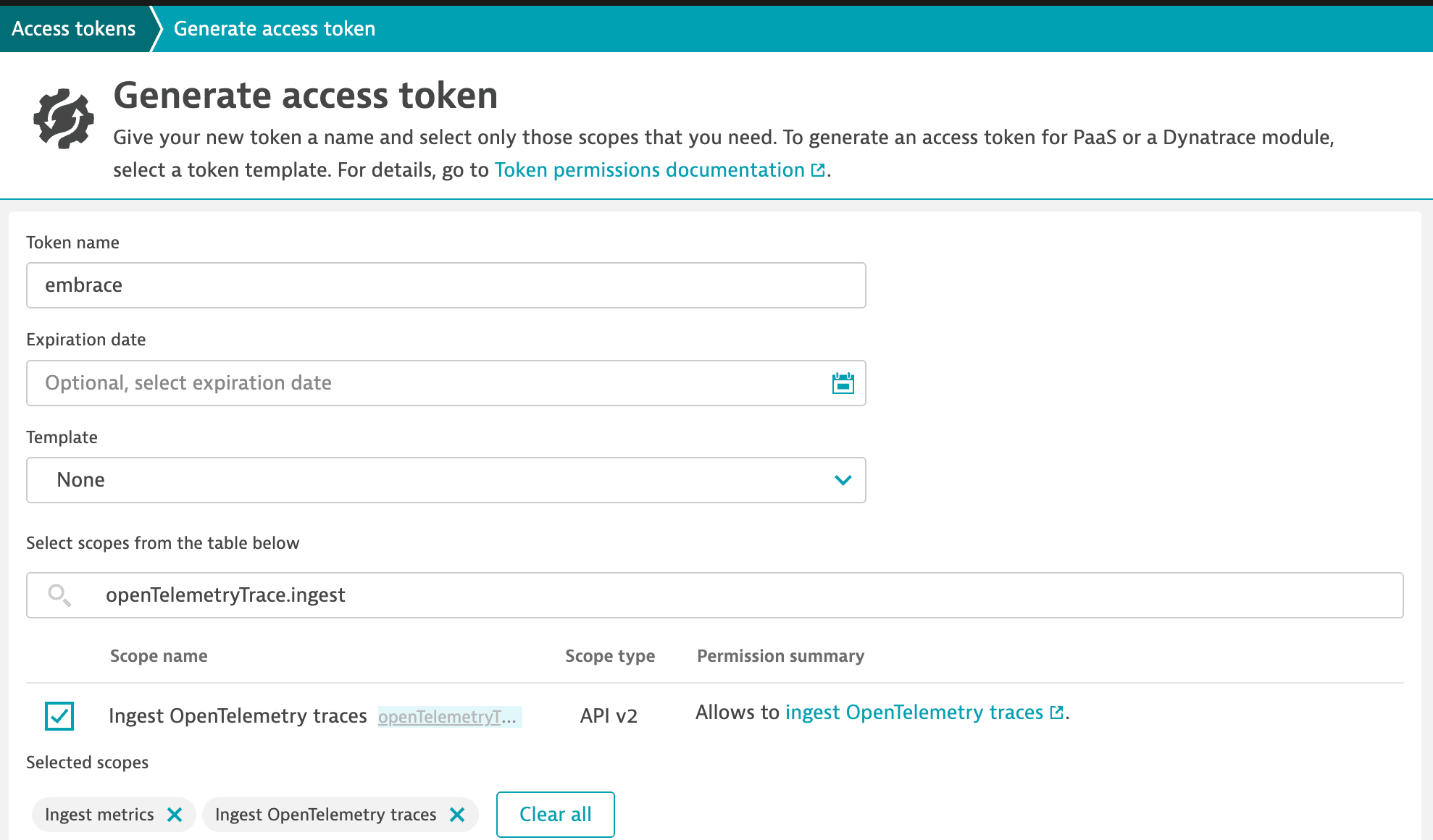
- Select Generate token, then copy the token. It starts with
dt0c01..
To create a platform token:
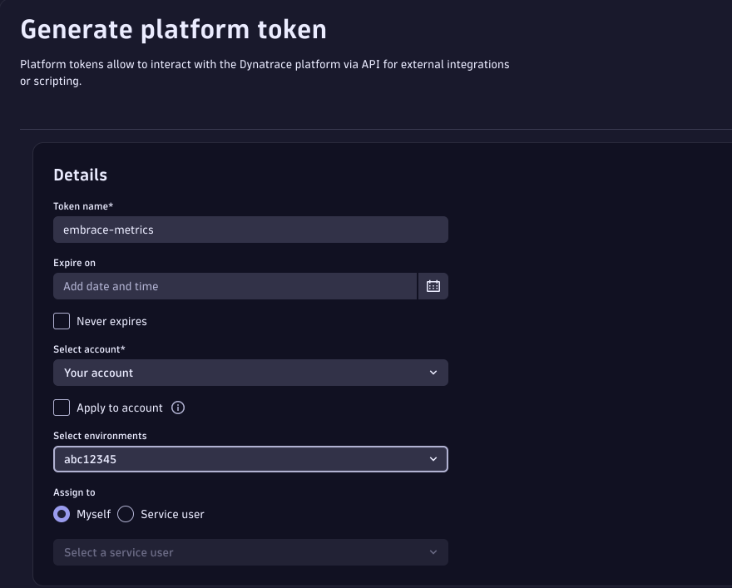
- Open Account Management, then My platform tokens, and select Create token.
- Enter a name, and select the account and the environment that receives your metrics.
- Search for
openpipeline:metricsand select the openpipeline:metrics:ingest scope. If you forward network spans, also search foropenpipeline:tracesand select the openpipeline:traces:ingest scope.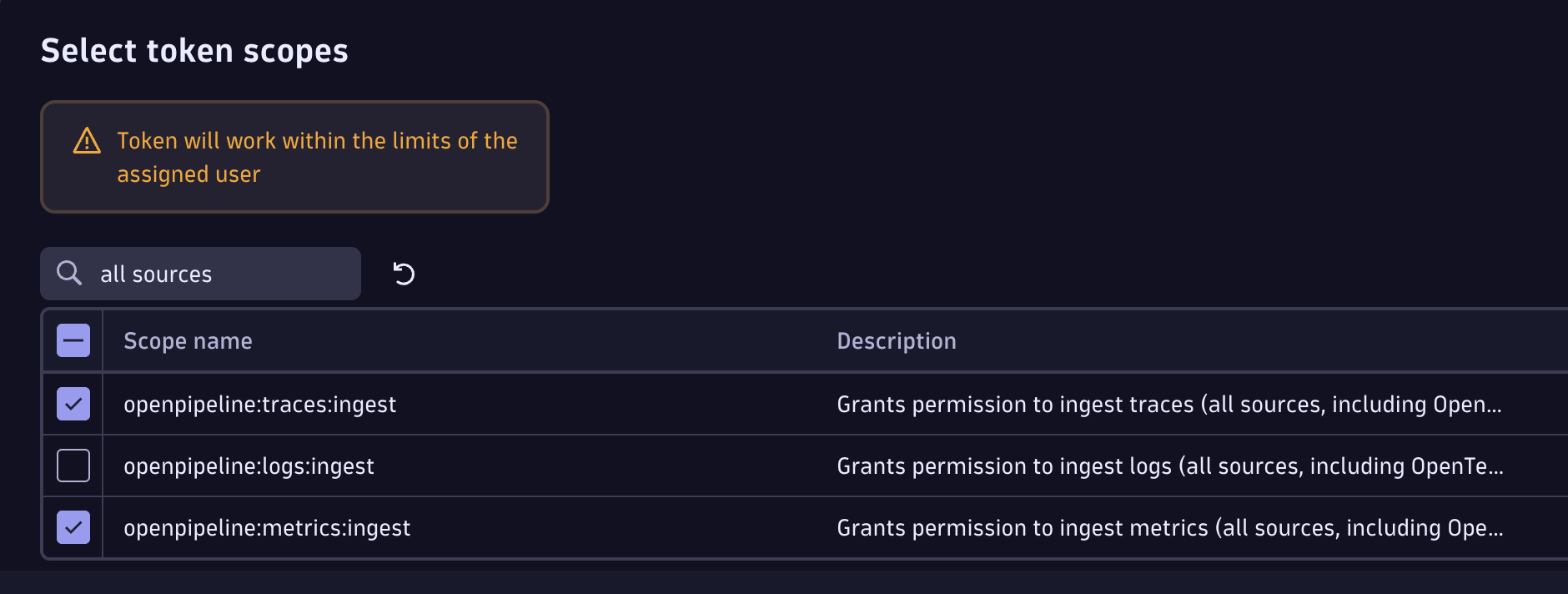
- Select Generate, then copy the token. It starts with
dt0s16..
Dynatrace shows each token only once, so copy it before you leave the page.
Add the data destination
In the Embrace dashboard, open Settings -> Integrations -> Data Destinations, add a data destination, and select Dynatrace. Paste your token and environment URL, then save.
Embrace sends a test metric when you save, and a test span when you turn on network span forwarding. If Dynatrace rejects either one, the error message includes the reason Dynatrace gave, such as a missing scope.
Querying your data
Metrics
Your metrics are named embrace.<metric_name>.<time_granularity>, such as embrace.crashes_total.daily.
To query them with the Dynatrace Query Language (DQL), open a Notebook and add a DQL section:
timeseries crashes = sum(embrace.crashes_total.daily), from: now()-7d
In the classic Data Explorer, counter metrics have a .count suffix, such as embrace.crashes_total.daily.count.
When metrics arrive
Dynatrace's classic metrics storage, which backs the Data Explorer, only keeps a data point if it arrives within an hour of the end of its time window. Embrace sends each window's metrics within that hour. If Embrace can't send a window in time, for example after an outage, it skips that window rather than sending data that Dynatrace would drop.
Network spans
You can find your forwarded network spans in the Distributed Tracing app. If your backend services send their traces to the same Dynatrace environment, their spans join the same trace as the network span that called them.
Forwarded network spans carry your Embrace app ID in the emb.app_id attribute. To query them with DQL, open a Notebook and add a DQL section:
fetch spans, from: now()-24h
| filter isNotNull(emb.app_id)
When network spans arrive
Dynatrace keeps a span only if it arrives within an hour of its end time, and its end time is no more than 10 minutes in the future. Embrace forwards a network span after it receives the session it belongs to. If an app sends a session late, for example the next time it launches, Dynatrace drops the spans from that session without an error.
Troubleshooting
If metrics are missing, check Dynatrace's self-monitoring metrics in a Notebook.
Data points rejected by the OTLP API, grouped by reason:
timeseries rejected = sum(dt.sfm.active_gate.metrics.ingest.otlp.datapoints.rejected), by: {reason}, from: now()-24h
Data points dropped by classic metrics storage, such as points that arrived too late, grouped by reason and metric:
timeseries dropped = sum(dt.sfm.server.metrics.rejections), by: {rejectionreason, metric_key}, from: now()-24h
If network spans are missing, check the spans Dynatrace dropped, grouped by reason. Time out of range means a span arrived too late or too far in the future:
timeseries dropped = sum(dt.sfm.server.spans.dropped), by: {reason}, from: now()-24h