Watchdog Terminations
Watchdog Terminations
Watchdog terminations are currently available for iOS apps using the Embrace Apple SDK.
When iOS force-terminates your app, the process receives a SIGKILL that no in-process crash reporter can catch.
This can happen when your app blocks the main thread for too long, overheats the device, or holds a file lock while
being suspended. Apple's MetricKit framework reports these terminations on the next app launch, and Embrace collects
and groups those reports so you can see why the OS is killing your app.
Requirements
- Use version 6.19.0 or later of the Embrace Apple SDK, which captures MetricKit crash reports by default.
- MetricKit capture requires the default KSCrash-based crash reporter. If you pass
crashReporter: nilor use theCrashlyticsReporter, MetricKit capture is disabled. See Crash Reporting in iOS for details.
The Watchdog Terminations tab appears on the Crashes page once Embrace receives MetricKit reports with termination reasons for your app.
Viewing watchdog terminations in the dashboard
The summary view charts watchdog terminations by watchdog event, shows other termination codes separately, and lists every termination reason with its event and device counts.
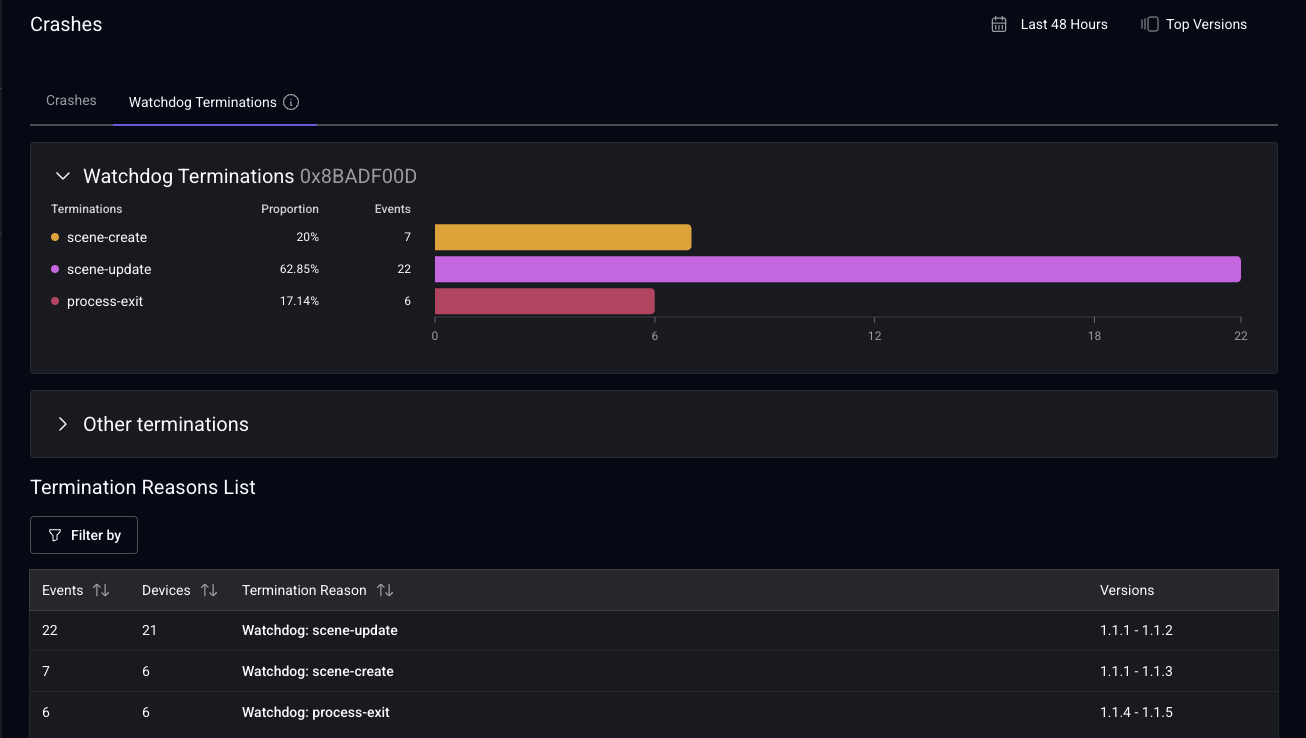
Each row in the table represents one termination reason:
- Events: Total count of termination events for this termination reason
- Devices: Unique devices affected by this termination reason
- Termination Reason: The termination code and, for watchdog kills, the watchdog event that triggered it
- Versions: The app version range where this termination reason has been observed
You can filter the view by attributes like build, device model, OS version, and user identifier, as well as termination-specific fields like process visibility and termination code. See Filters for definitions of common filters.
Termination reasons
Terminations are grouped by the termination code Apple includes in the report, combined with the watchdog event for watchdog kills:
| Code | Label | What it means |
|---|---|---|
0x8BADF00D | Watchdog | The OS watchdog killed the app because an operation took too long, such as launching, updating a scene, or exiting |
0xC00010FF | Thermal Kill | The OS killed the app in response to a thermal event |
0xDEAD10CC | File Lock on Suspend | The app held a file or database lock while being suspended |
0x2BAD45EC | Drawing While Locked | The app drew to the screen while the device was locked |
Watchdog kills are further grouped by the watchdog event, for example Watchdog: scene-update or
Watchdog: process-launch. Each watchdog kill also records an exhaustion type: wall clock time, CPU time, graceful
termination timeout, or deadlock.
The codes and their meanings come from Apple, and terminations with a code that is not in this table show the raw code instead of a label. See Apple's documentation on addressing watchdog terminations and the termination codes delivered with SIGKILL for more detail.
Termination details
Click a termination reason to open its details page, which shows a count-by-version chart over time and the list of individual termination events.
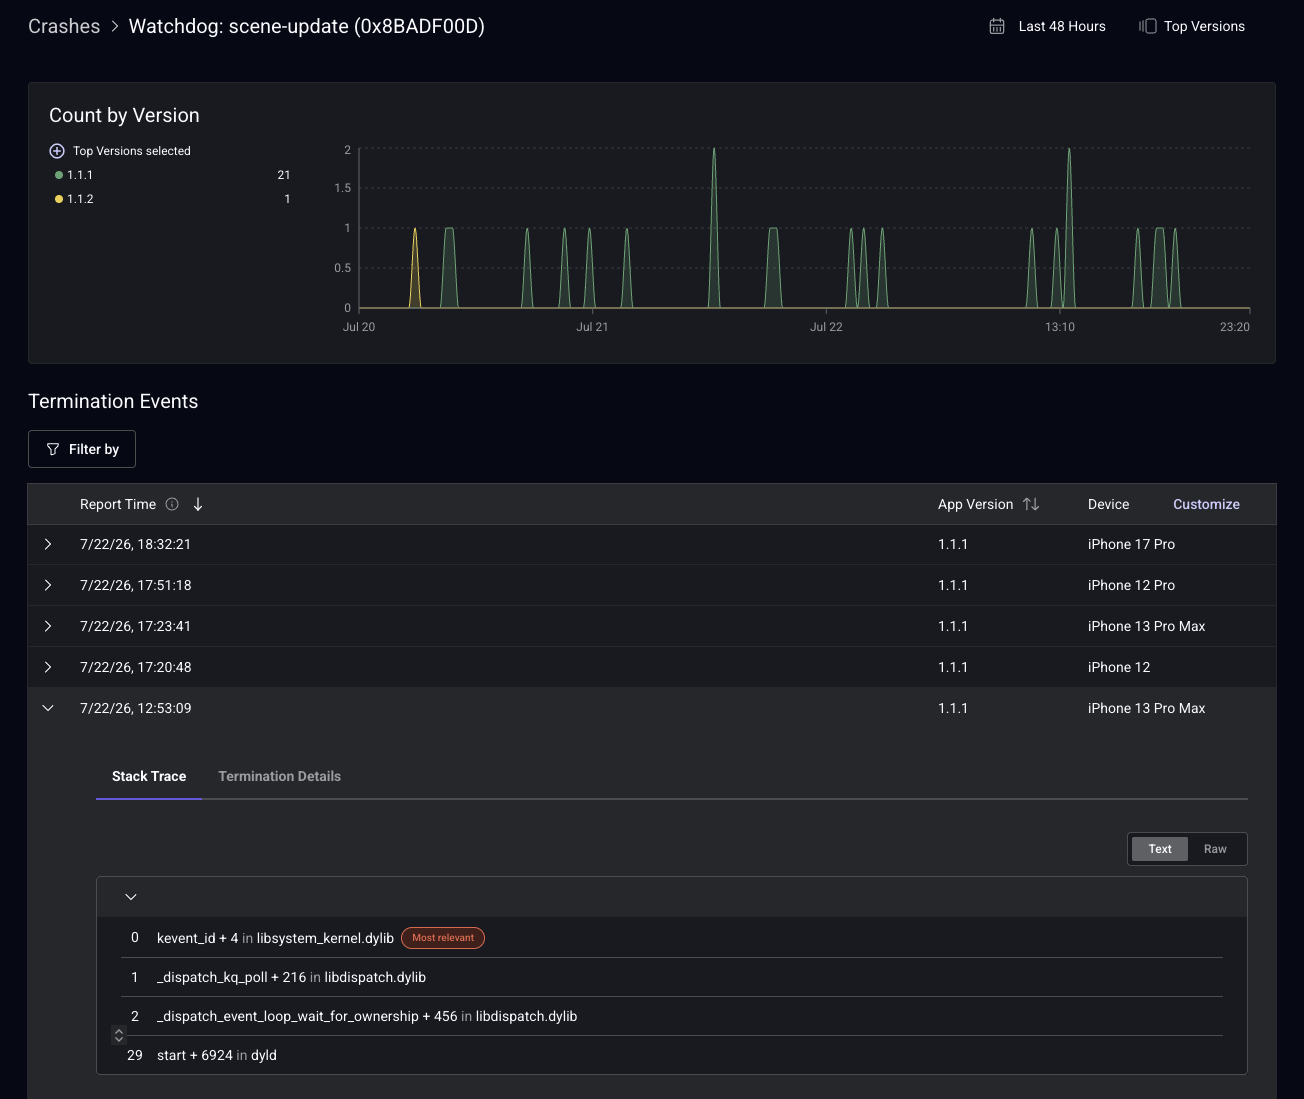
Each termination event shows the report time, app version, and device, and you can use Customize to choose which columns appear. Expand an event to see:
- Stack Trace: The symbolicated stack trace captured at termination, in the same viewer used for crashes
- Termination Details: The raw termination text from MetricKit, including elapsed time, CPU statistics, and the OS explanation for the termination
Good to know
- Report times are approximate. Apple does not expose the exact time of the termination. MetricKit batches diagnostic reports and delivers them on the next app launch.
- Watchdog terminations are not associated with sessions. MetricKit reports arrive outside of session context, so termination events do not link to user sessions, do not affect crash-free rates, and are not available in alerts, widgets, or custom metrics at this time.