Exception Severity Score
Severity scoring is currently available for Web exceptions only.
Embrace automatically calculates a severity score for every exception to help you prioritize the most critical issues affecting your users. The severity score is a value between 0 and 1, where higher scores indicate more severe exceptions that require immediate attention.
Viewing Severity Scores in the Dashboard
In the Embrace dashboard, exceptions are grouped by their stack trace line and displayed as a list. Each row represents a group of exception events that share the same location in your code.
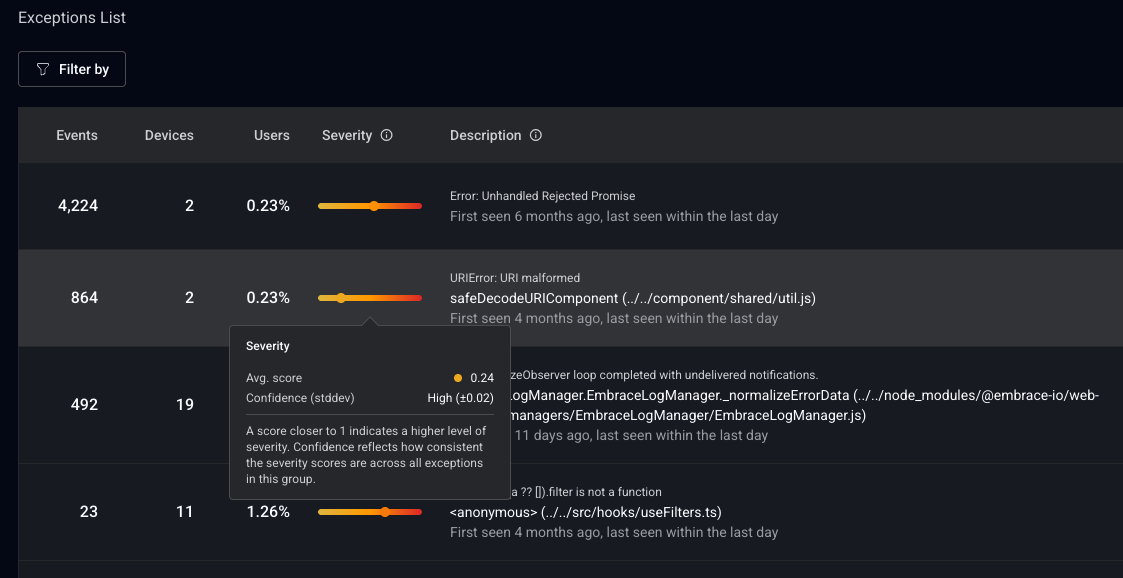
The severity score column displays the average severity score across all exception events in that group. This average helps you quickly identify which exception groups are causing the most severe issues for your users.
Additional columns provide context for prioritization:
- Events: Total count of exception occurrences in this group
- Devices: Unique devices affected by this exception
- Users: Proportion of your user base experiencing this exception
- Versions: Version range where this exception has been observed
By combining the average severity score with these metrics, you can prioritize exceptions that are both severe and widespread. For example, an exception with a high severity score affecting a large percentage of users should be addressed before a similarly severe exception affecting only a few devices.
Hovering over a severity score reveals a tooltip showing the confidence level (based on standard deviation) for the average value calculated for that group, to give more insight into the distribution of scores within the group.
How it works
The severity score algorithm combines a base severity with multiple contextual multipliers to produce a final score that reflects both the nature of the exception and the circumstances under which it occurred.
Base Severity
The base severity depends on whether the exception was handled:
- Handled exceptions: 0.30 base severity
- Unhandled exceptions: 0.60 base severity
Unhandled exceptions receive a higher base score because they typically indicate more serious problems that could cause the application to stop functioning or lead to degraded user experience.
Contextual Multipliers
After calculating the base severity, the algorithm applies several contextual multipliers based on factors surrounding the exception. Each multiplier is applied multiplicatively to the score, and the final result is clamped to a maximum of 1.0.
1. Node Modules Multiplier
Range: 0.5x - 1.0x
Exceptions occurring in third-party library code (node_modules) are considered less severe than those in your application code.
- In node_modules: 0.5x (reduces severity)
- In application code: 1.0x (no change)
2. Time to Session End Multiplier
Range: 0.8x - 1.2x
This multiplier considers how quickly the session ended after the exception occurred, which can indicate whether the exception prevented the user from using the application.
| Time to Session End | Multiplier | Impact |
|---|---|---|
| < 1 second | 1.2x | Exception likely caused immediate session end |
| 1-3 seconds | 1.15x | Very likely related to session end |
| 3-5 seconds | 1.10x | Possibly related to session end |
| 5-10 seconds | 1.0x | Neutral |
| > 10 seconds | 0.8x | Session continued normally |
3. Failed Span Multiplier
Range: 1.0x - 1.3x
Exceptions that occur near the time of a failed performance span (operation) receive increased severity, as they may be causally related.
The multiplier is based on temporal proximity:
- < 1 second: 1.3x
- 1-3 seconds: 1.24x
- 3-5 seconds: 1.18x
- 5-10 seconds: 1.12x
- > 10 seconds: 1.0x
4. Failed Network Request Multiplier
Range: 0.8x - 1.4x
Network failures near an exception can indicate the root cause. The severity adjustment depends on the type of domain and temporal proximity.
Domain Priority:
- First-party domains or document load domains: 1.0x - 1.4x (scaled by proximity)
- These failures are most severe as they represent calls to endpoints owned by the application
- Third-party domains: 1.0x - 1.2x (scaled by proximity)
- Moderate severity for general third-party failures
- Ad/Analytics domains: 0.8x (fixed)
- Lower severity as these are typically non-critical to core functionality
Proximity Scaling (for first-party and third-party):
- < 1 second: Maximum multiplier (1.4x or 1.2x)
- 1-3 seconds: 80% of range
- 3-5 seconds: 60% of range
- 5-10 seconds: 40% of range
- > 10 seconds: 1.0x (neutral)
5. User click multiplier
Range: 1.0x - 1.15x
Exceptions that occur shortly after a user click receive increased severity, as they represent issues triggered directly by user actions.
The multiplier is based on how recently the click occurred before the exception:
- < 1 second: 1.15x
- 1-3 seconds: 1.12x
- 3-5 seconds: 1.09x
- 5-10 seconds: 1.06x
- > 10 seconds or no click: 1.0x
6. Empty Root Node Multiplier
Range: 1.0x - 2.0x
Once you have configured the Empty Root Node instrumentation then any exceptions that are followed by your application's root node being rendered empty will receive drastically increased severity, as this typically indicates the exception caused the application UI to break or become blank, severely impacting user experience.
The multiplier is based on how soon the empty root node was rendered after the exception:
- < 1 second: 2.0x
- 1-3 seconds: 1.8x
- 3-5 seconds: 1.6x
- 5-10 seconds: 1.4x
- > 10 seconds or no empty root node: 1.0x
Example Calculation
Here's an example of how the severity score is calculated:
Base Severity: 0.60 (unhandled exception)

Multipliers:
- Node Modules: 1.0x (in application code)
- Time to Session End: 1.15x (session ended 2 seconds later)
- Failed Span: 1.0x (no failed spans nearby)
- Failed Network: 1.12x (third-party domain failed 4 seconds before)
- User Click: 1.09x (click occurred 4 seconds before)
- Empty Root Node: 1.0x (no empty root node rendered)

Calculation:
0.60 × 1.0 × 1.15 × 1.0 × 1.12 × 1.09 × 1.0 = 0.84

Final Score: 0.84