Traces in the Dashboard
Root Spans
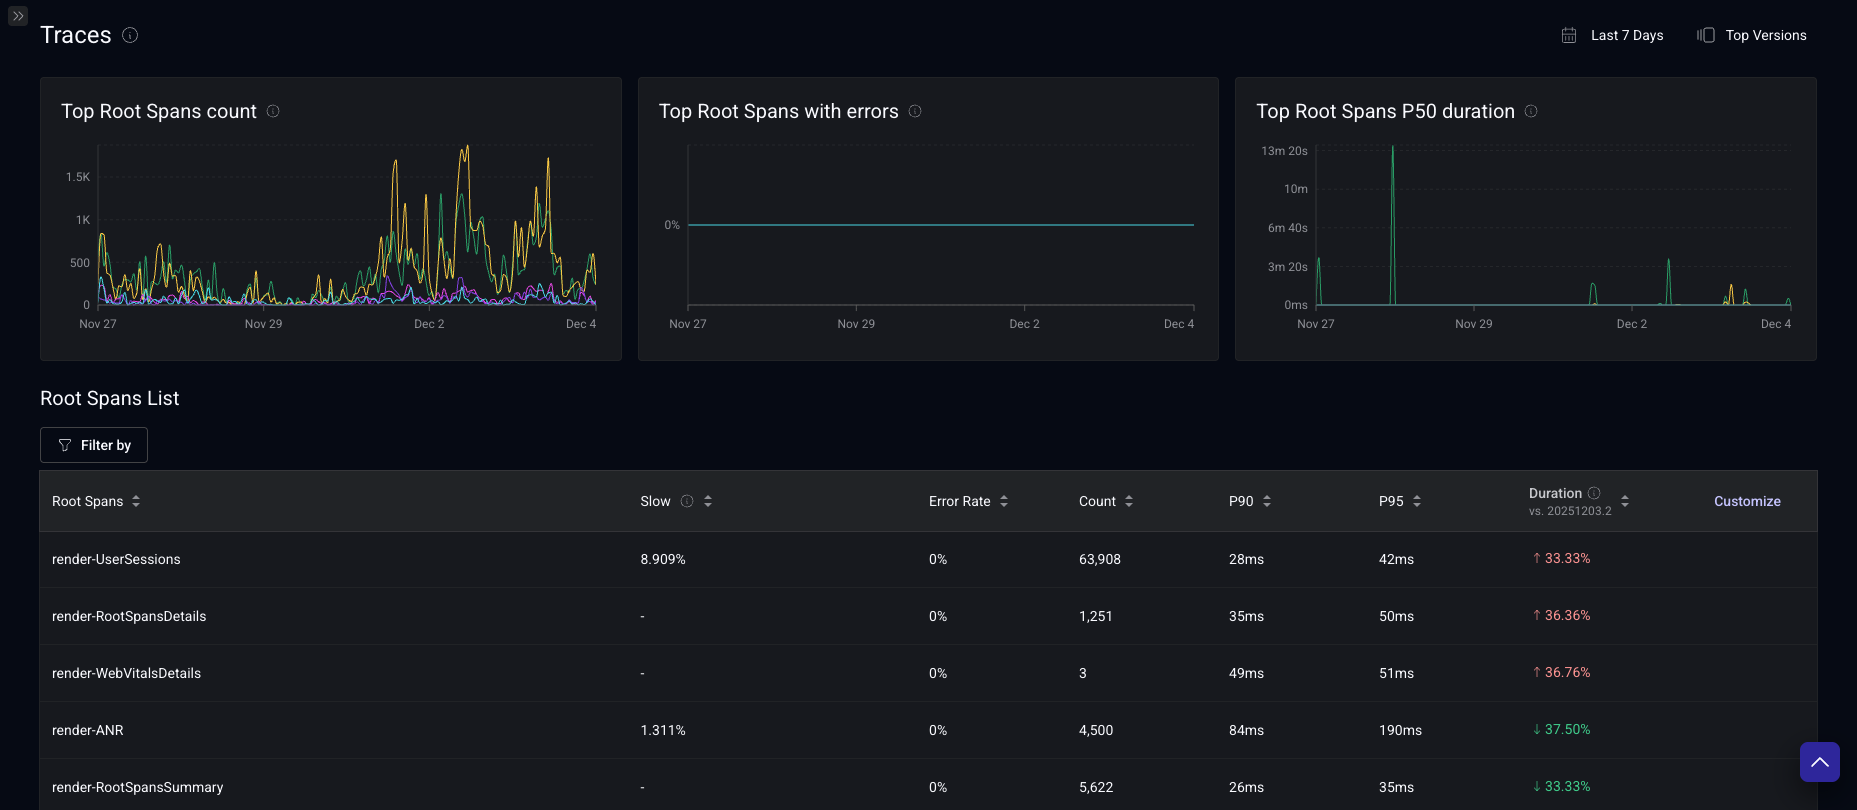
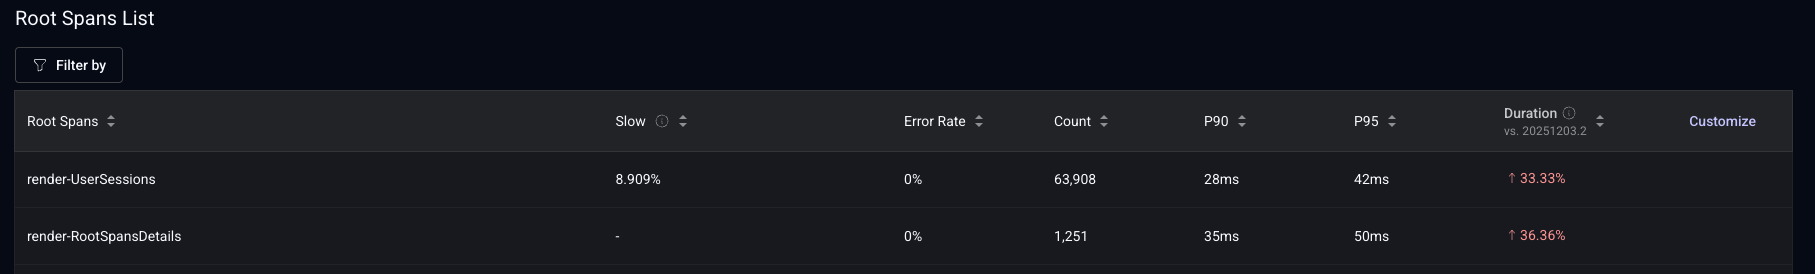
The primary page shows all root spans in your app, as well as summary metrics like count, error rate, percentiles of duration, and changes from a previous version.
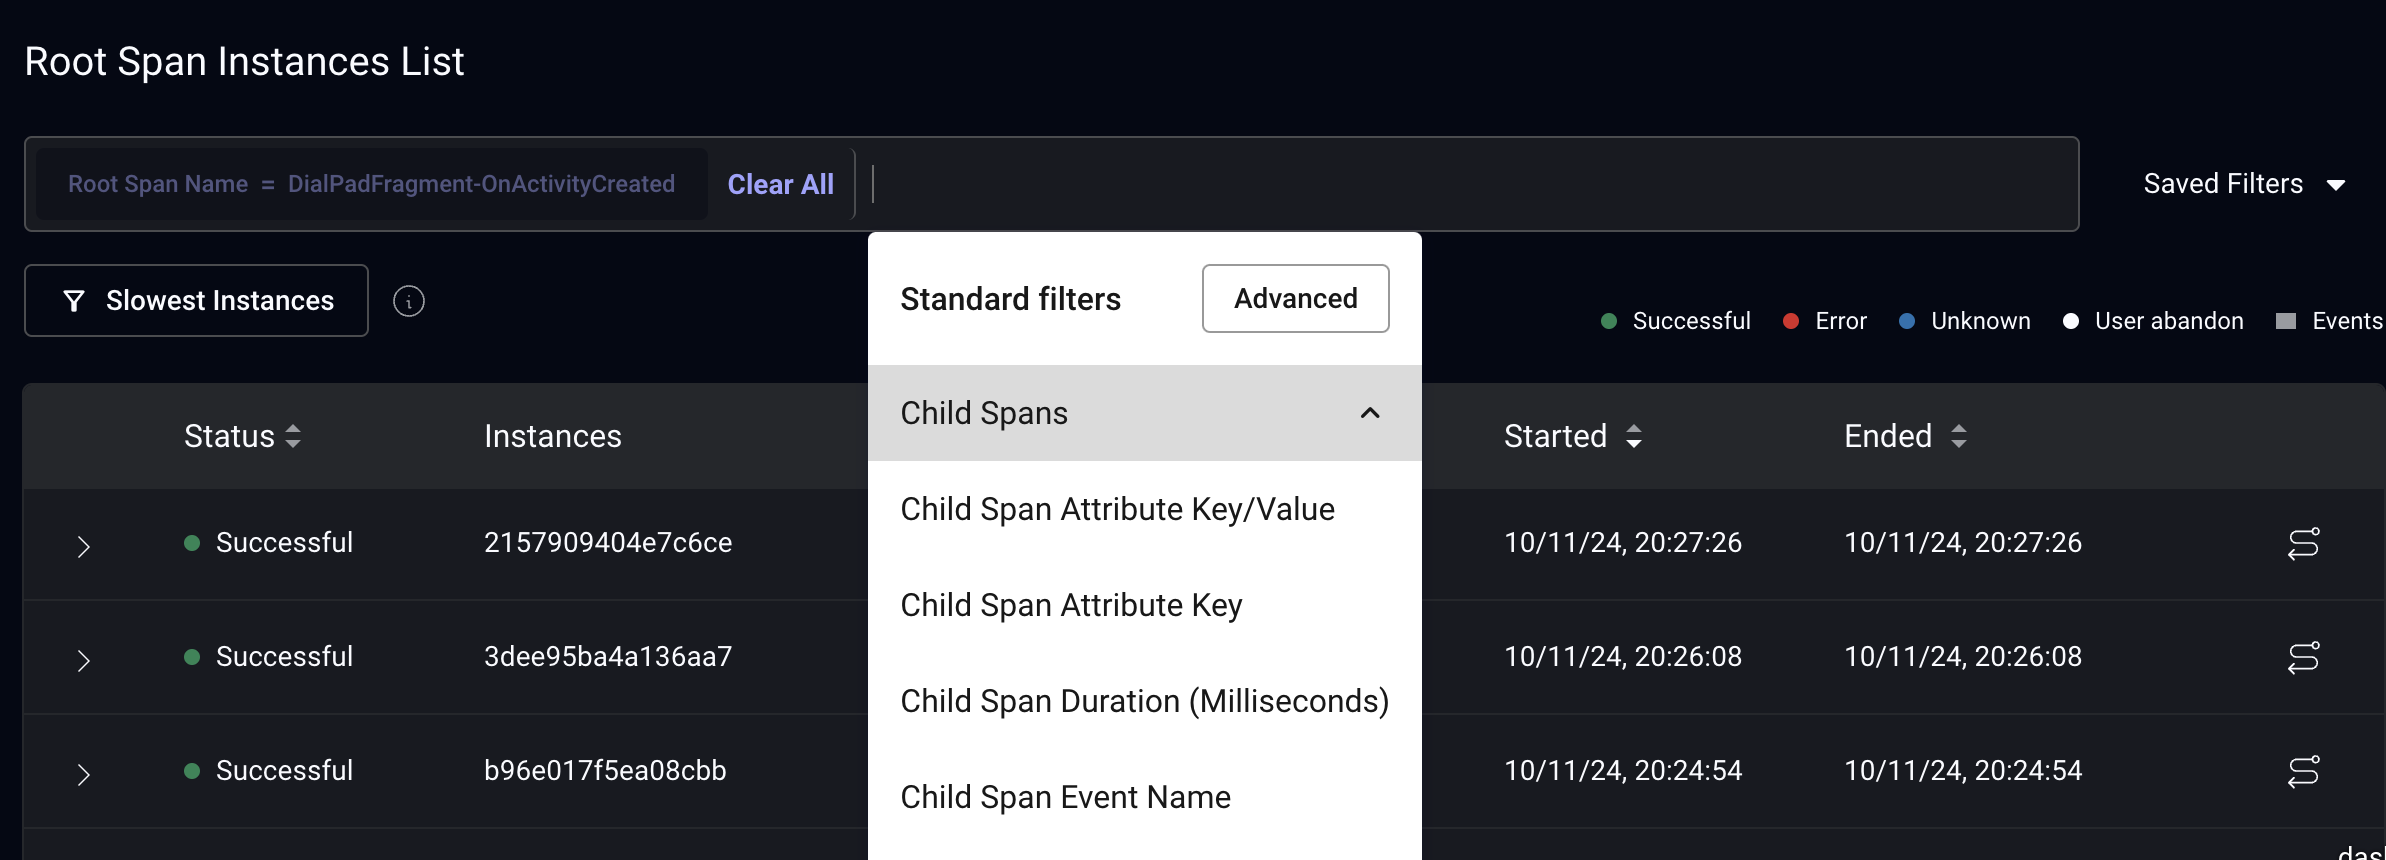
To narrow down the root spans that are summarized in this view, you can apply the following filters on the root span as well as the child spans:
- Name
- Duration*
- Outcome
- Attributes keys and values
- Span event names
*failed Spans are not included for duration aggregates, they are displayed as 0
Root Span Summary View
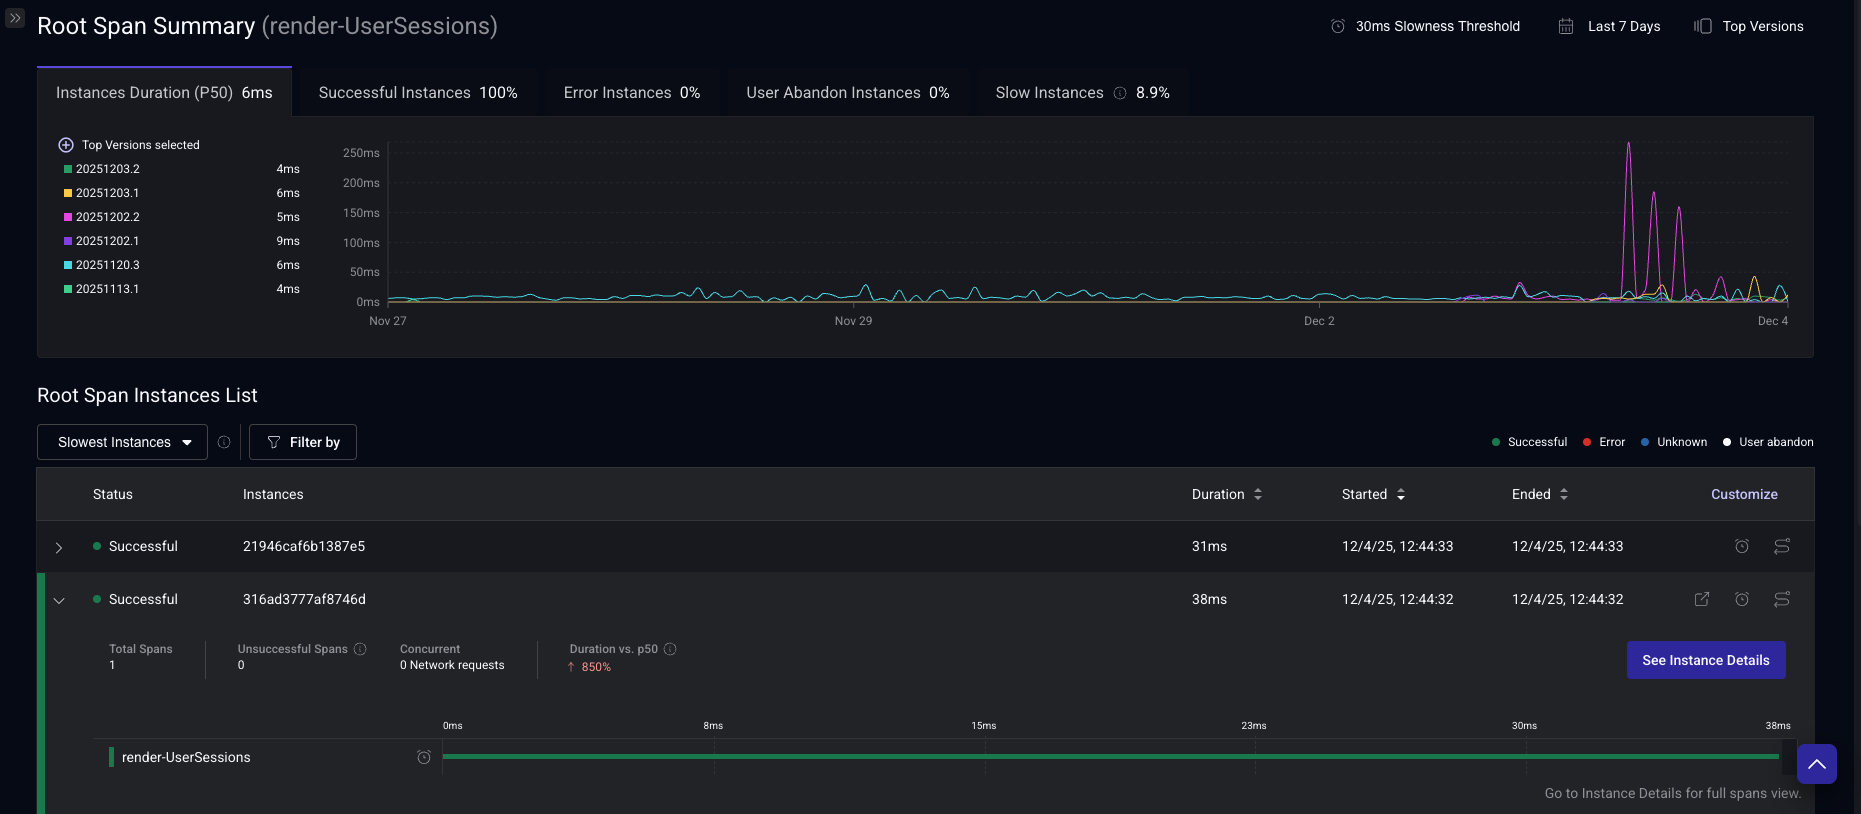
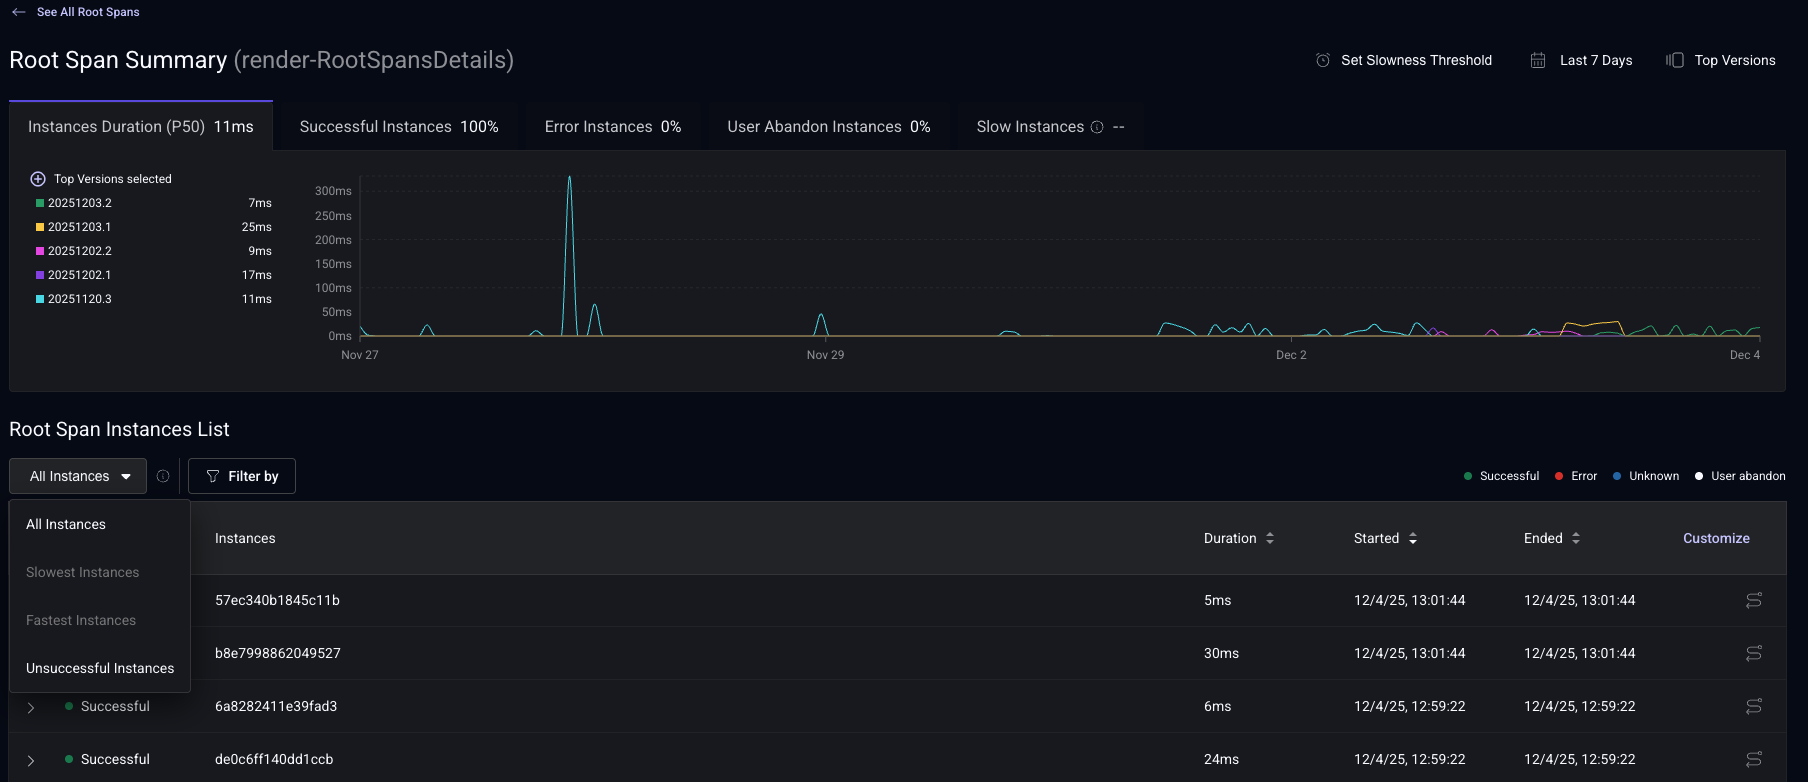
By clicking on the name of a Root Span in the Root Spans View, you can see a partial listing of all the instances of that Root Span.
Each row represents a specific instance of that Root Span being recorded. You can see its status, unique Span ID, and duration, in addition to start and end times. All of these columns other than the Span ID is sortable.
Clicking on the instance will open up an in-line preview of the details of that instance, including the child spans that it has, their duration, and whether they were completed successfully.
On the right side each row that shows a Root Span instance, there are three icons.
- The first one takes you to the Root Span Instance View, where you can see all the details about that instance, including attributes and events on each child span.
- The second one shows you information about slow root span instance.
- The third one takes you to the specific session in the User Timeline view that this instance ended in so you can see the full context of what happened before and after this Root Span was recorded.
You can filter by properties similar to those in the Root Span View.
Filter your instances by outcome with these filters:
- All: all instances displayed.
- Slowest: instances completed successfully with duration > slow root span threshold.
- Fastest: instances completed successfully and not slow (with duration < slow root span threshold).
- Unsuccessful:
- Error: instances encountered an error.
- Unknown: insufficient data to determine instance outcome.
- User Abandon: user navigated away before instance completion.
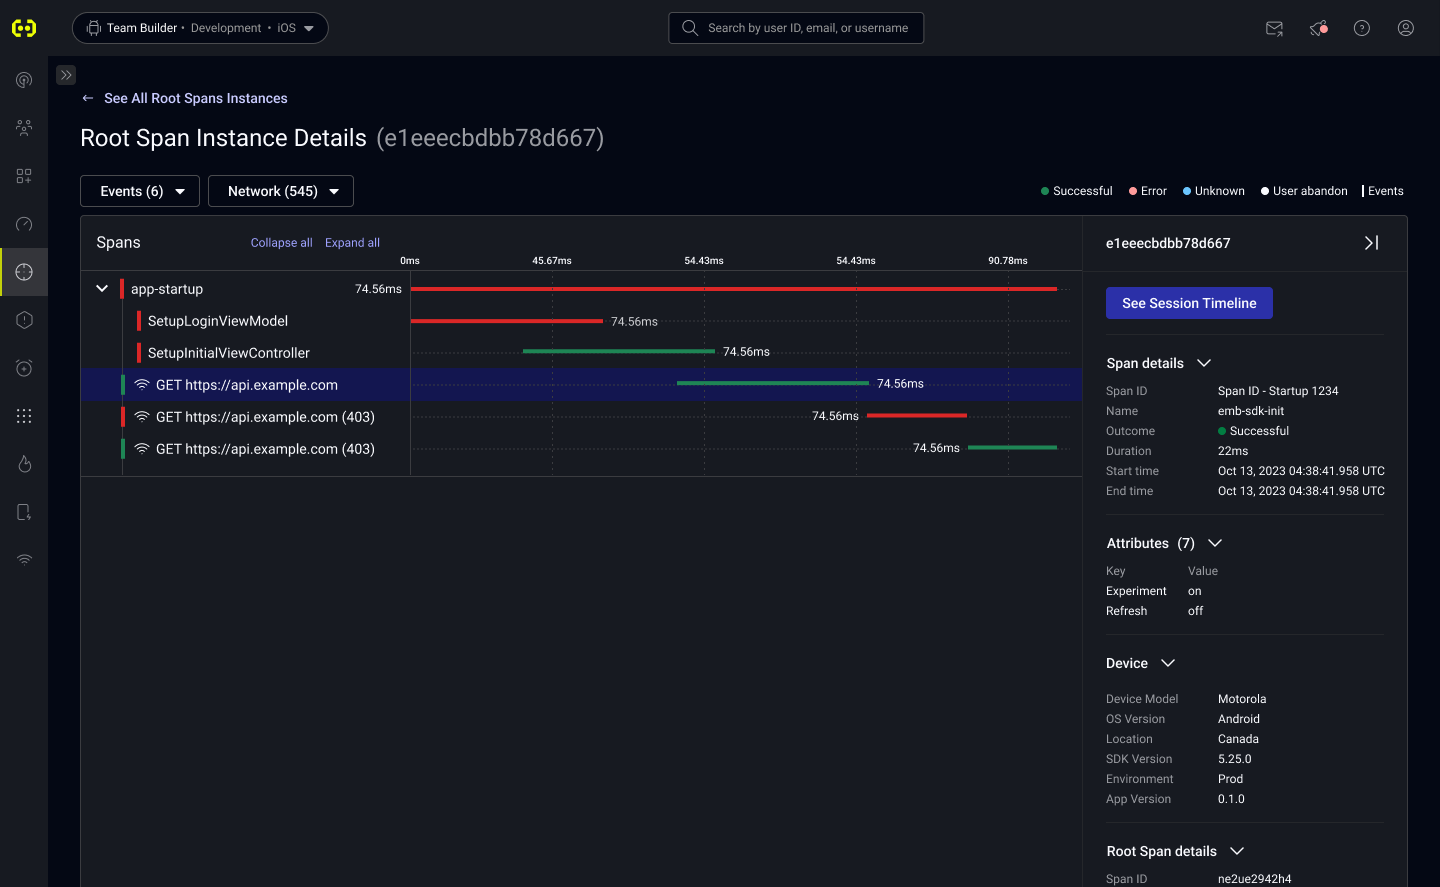
Root Span Instance View
This view shows a Root Span in its entirety. Not only you can see all the information in trace instance preview, you can also see at the individual events and attributes recorded as part of on a each child span, along with metadata about the device and app.
Slow Root Spans
With the Slow Root Spans feature, you can identify performance bottlenecks and prioritize your optimization efforts. Slow root spans are fully customizable, allowing you to define performance thresholds based on your specific SLOs and business objectives rather than relying solely on percentile calculations.
If the root span doesn't have a threshold configured, the feature is disabled for the root span, and you will not see information on the dashboard.
On the screenshot, you can see two root spans (render-UserSessions and render-RootSpansDetails), one with a threshold configured and the other one without threshold. You can see that the "Slow" column doesn't show a value when the root span doesn't have a slow threshold configured.
For render-UserSessions (it has a threshold configured), the "Slowest instances" and "Fastest instances" filters are enabled and at the top right you can see the threshold.
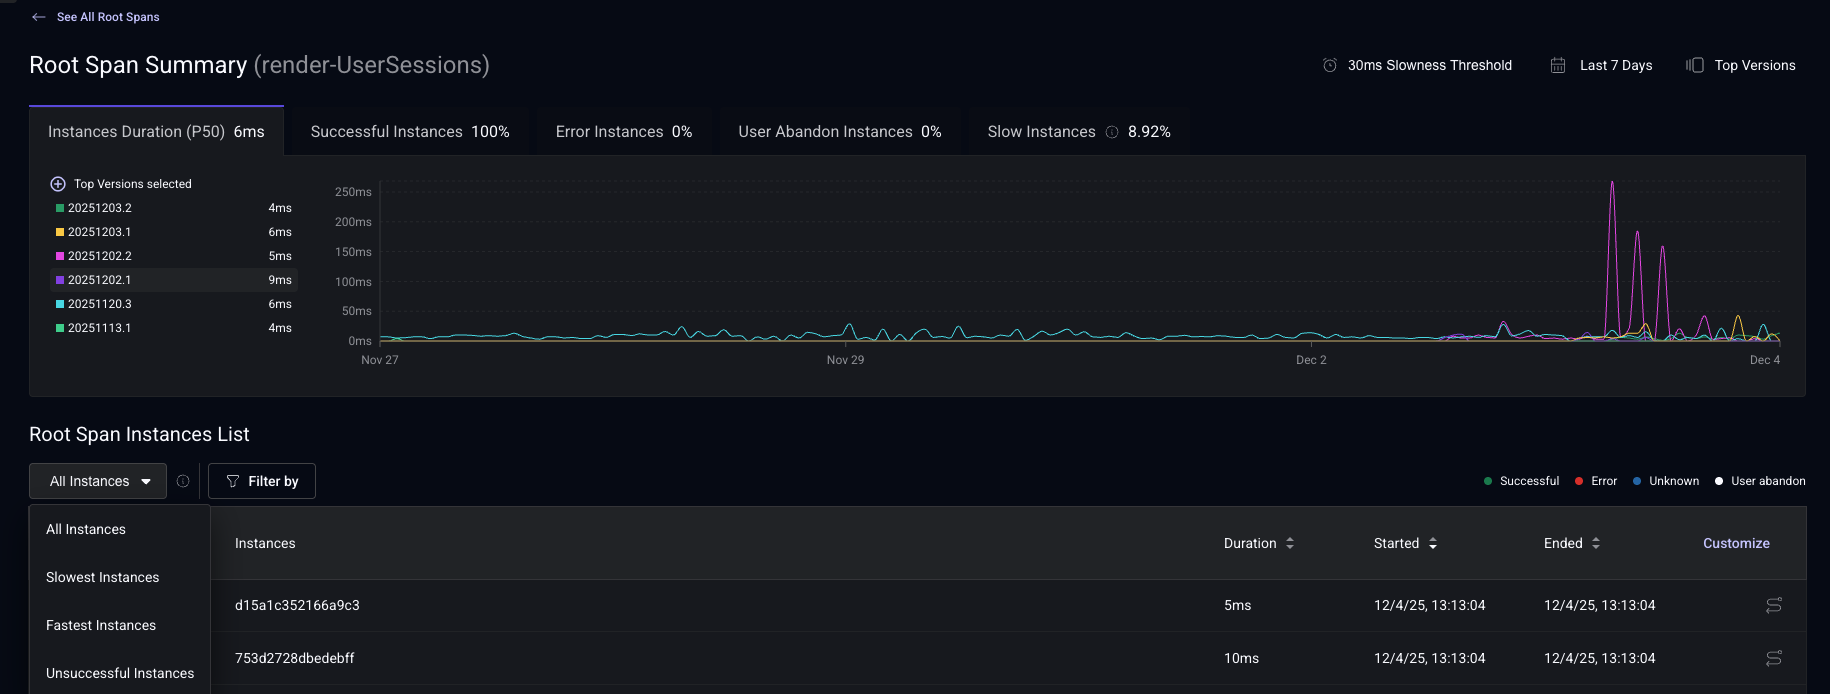
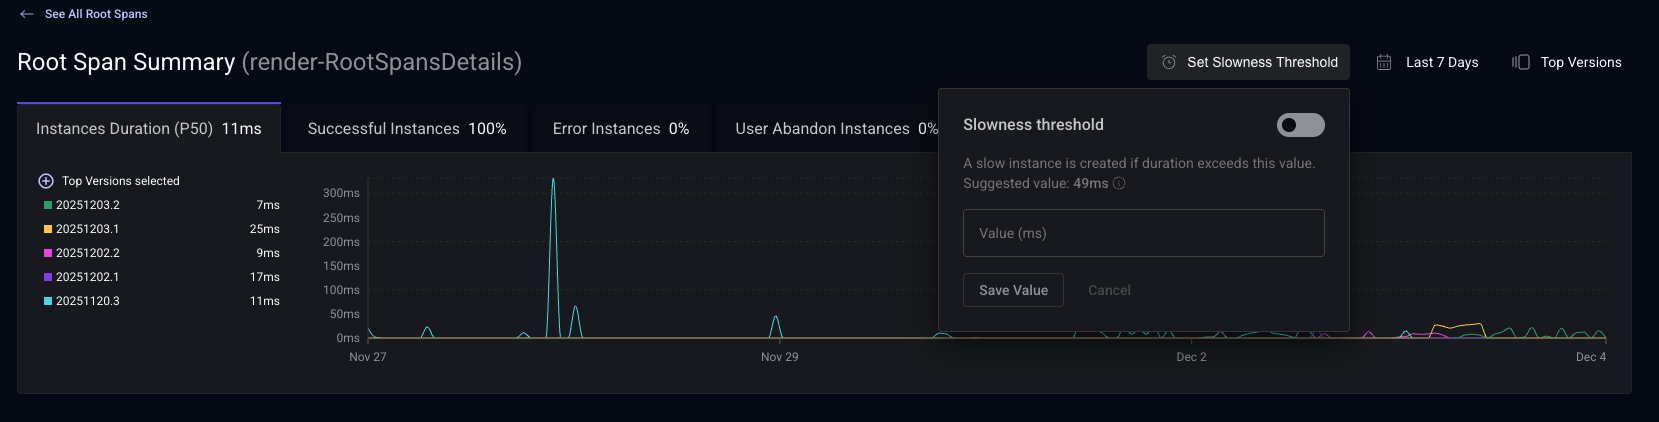
For render-RootSpansDetails (it doesn't have a threshold configured), the "Slowest instances" and "Fastest instances" filters are disabled and at the top right you can configure the threshold.
Setting Thresholds
- You can configure millisecond-based thresholds for any span in the Root Span Summary page. The suggested value is based on the p95 historical duration of the root span (top versions and last 7 days).
Once you saved the threshold, Embrace will start computing the slow root spans.
Where You'll See Slow Spans
- Root Span Summary: Slow Span indicator at the end of the row if root span instance took longer than defined threshold.
- Sessions: Issue indicators when sessions contain slow spans
- User Timeline: Dedicated slow span issue type rows
- Release Health: Expandable slow root spans cards with detailed metrics
- Issues: Root spans with at least one instance exceeding the slowness threshold
- Boards: New "Root Span Slowness Percentage" metric.
- Boards: New "Root Span Slowness Percentage" metric.
- Filtering: New "Has Slow Root Span" session attribute
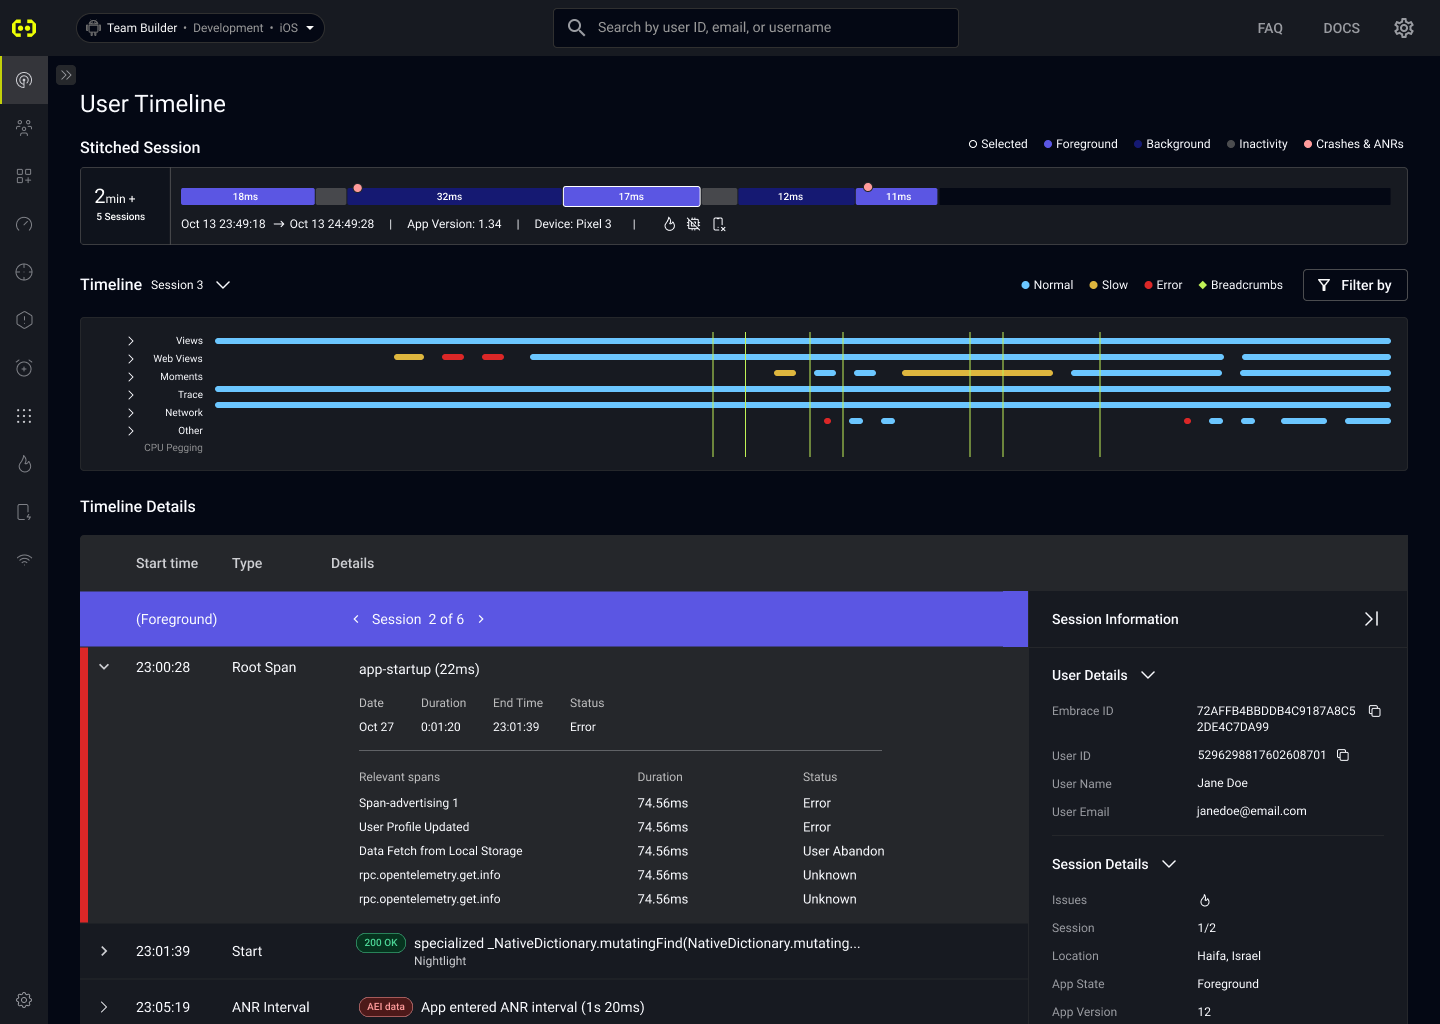
User Timeline view
Root Spans appear in both the Timeline View and Timeline Details.
Clicking on "See Details" for any Root Span within the timeline will take you directly to the Root Span Instance View.
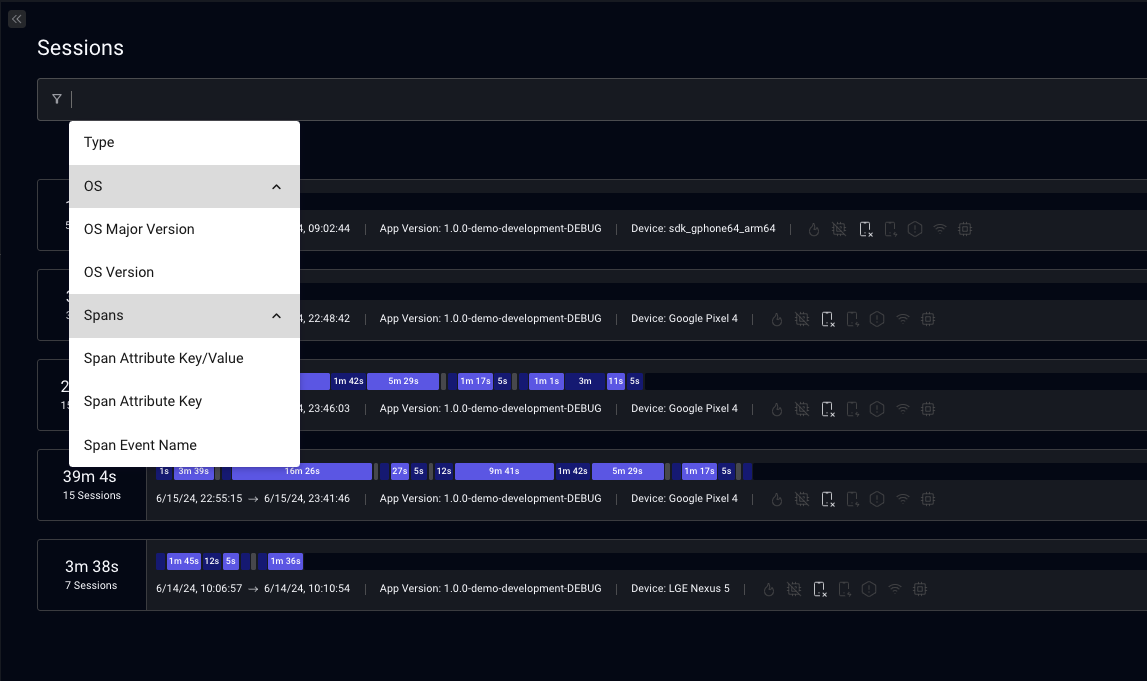
Sessions Filters
Not only you can filter spans in the various pages dedicated to Traces, you can filter sessions in the Sessions View by whether or not they contain specific spans with certain attributes and events.
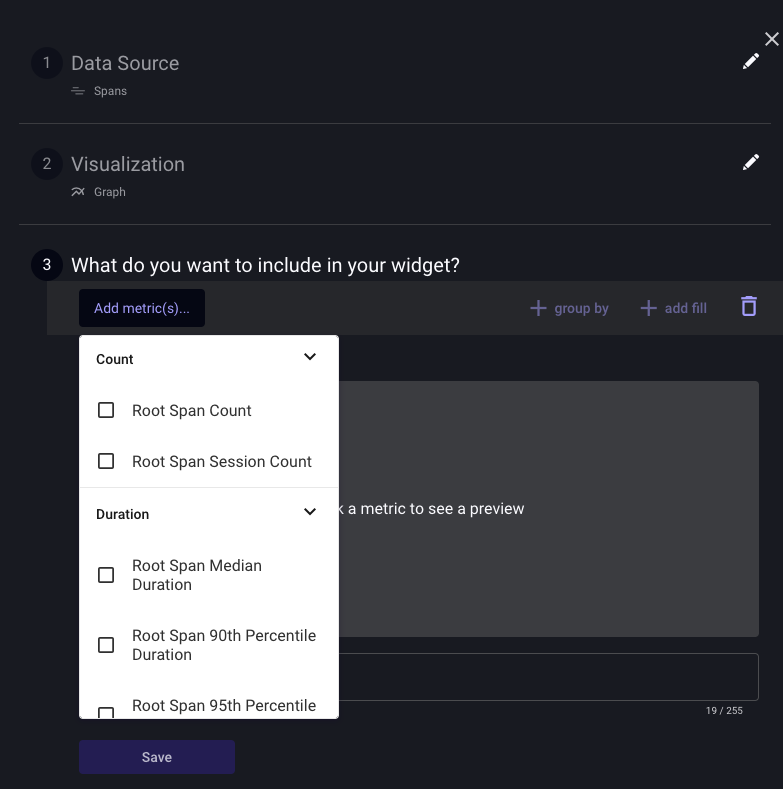
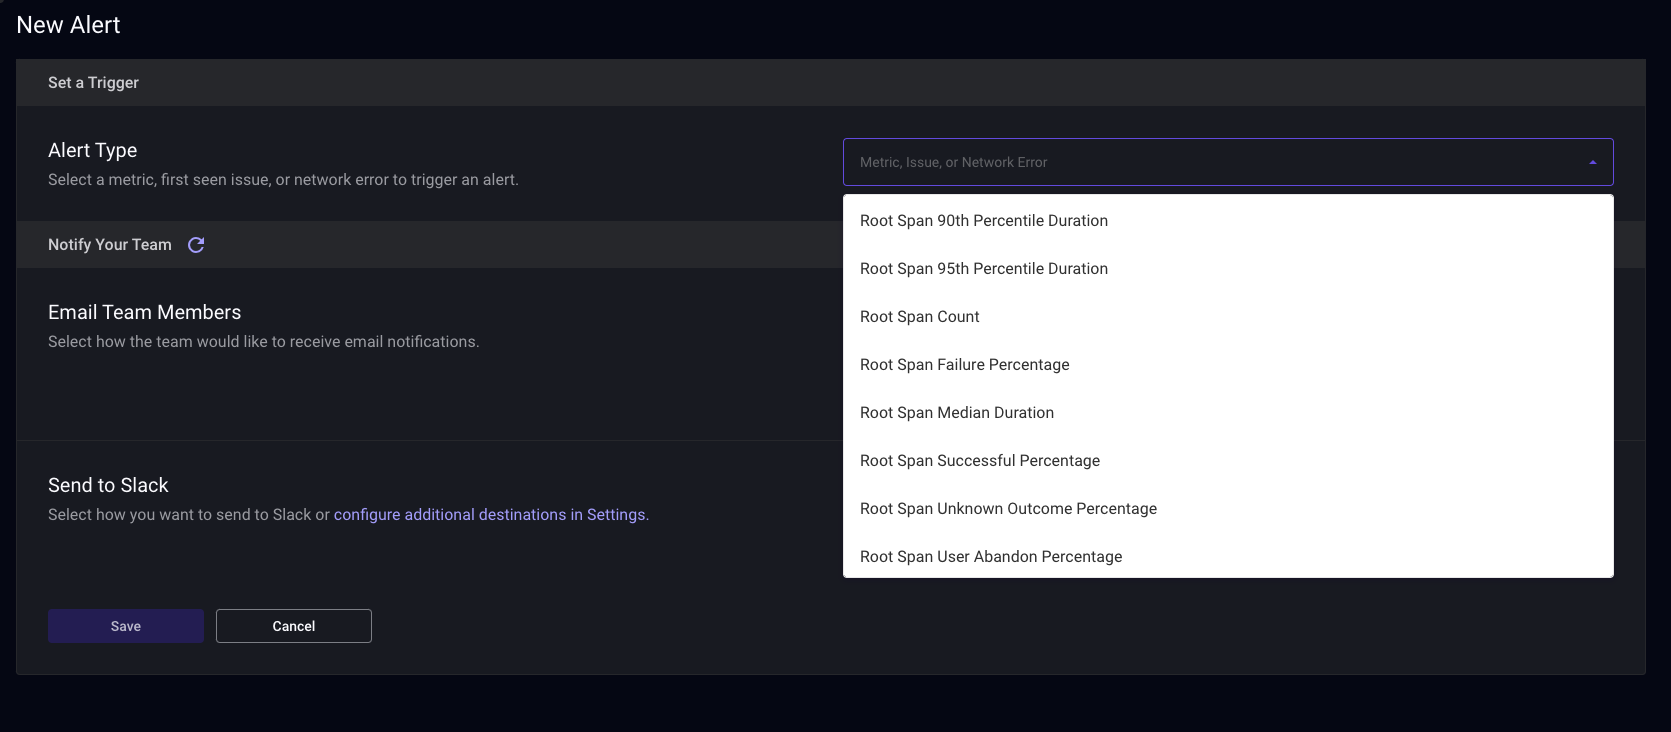
Boards, Alerts, and Custom Metrics
You can create Boards, Alerts, and Custom Metrics based on span data.