Network Monitoring
Network Summary
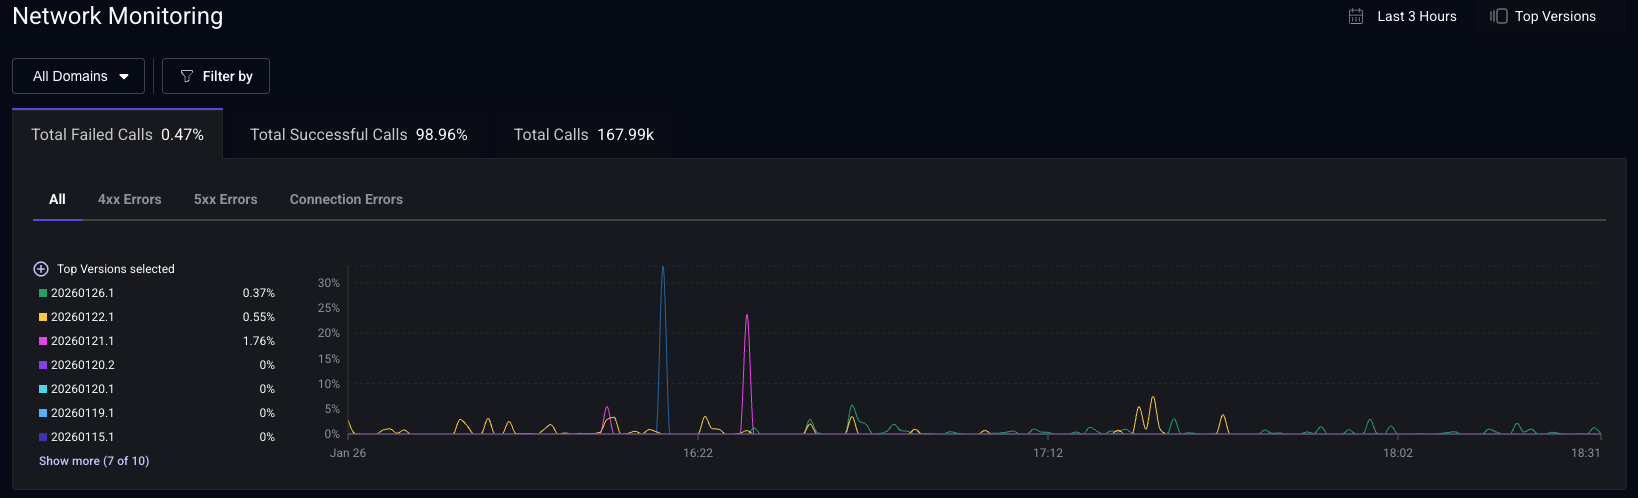
The Network Monitoring dashboard offers a high-level overview of your network requests. You can view the number of requests, and error counts grouped by 4xx/5xx status codes and connection errors. These metrics are also grouped by app version, enabling you to track changes in network performance over time with your releases. Use the filters to analyze network performance based on specific domains, countries, personas, and more.
Total Successful Calls vs Total Failed Calls
- Total Successful Calls: Percentage of requests that returned a 2xx response.
- Total Failed Calls: Percentage of requests that returned a 4xx or 5xx response, or failed due to a connection error (timeouts, DNS failures, network unavailability).
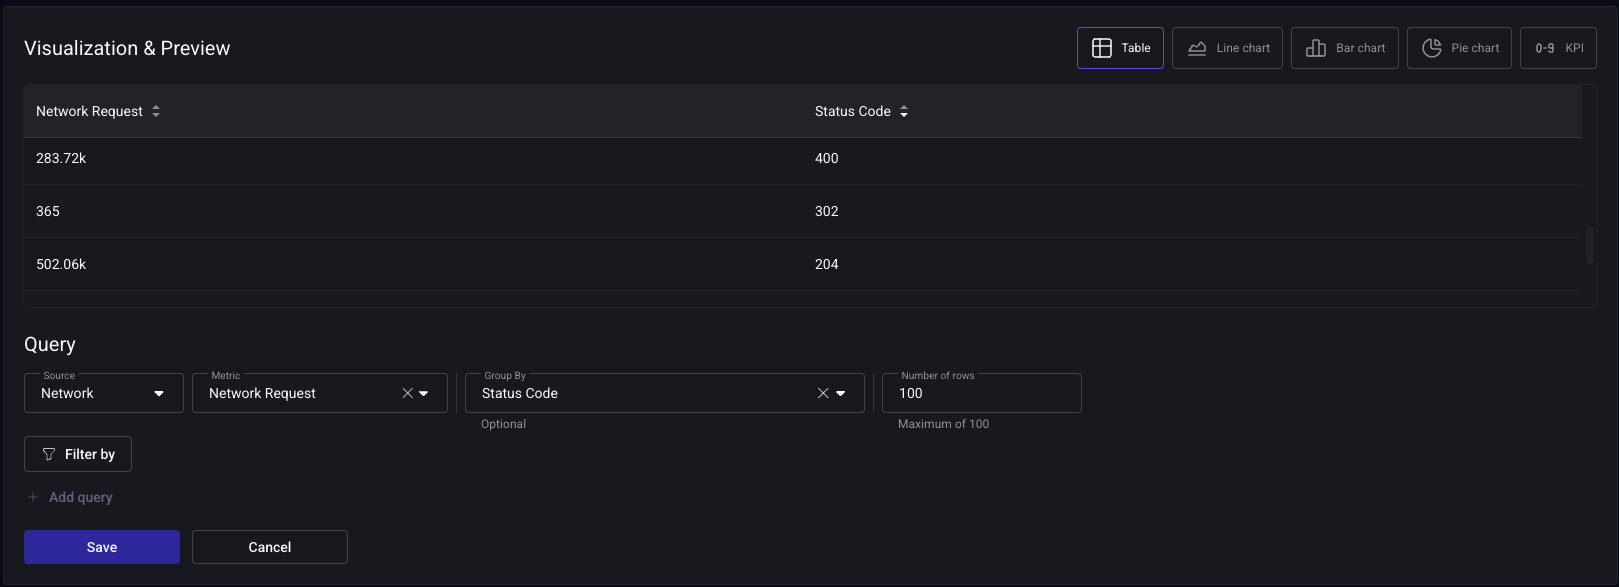
1xx (informational) and 3xx (redirects) responses are excluded from both metrics. To analyze these responses, create a custom dashboard using the Network Request metric grouped by Status Code.
Domain Type
Easily filter by domain type to focus on first-party, third-party, or media requests. Configure your first-party domains in the settings page for enhanced customization.
Embrace can help you diagnose network errors by forwarding network spans to your backend monitoring service. Read more about Network Spans Forwarding.
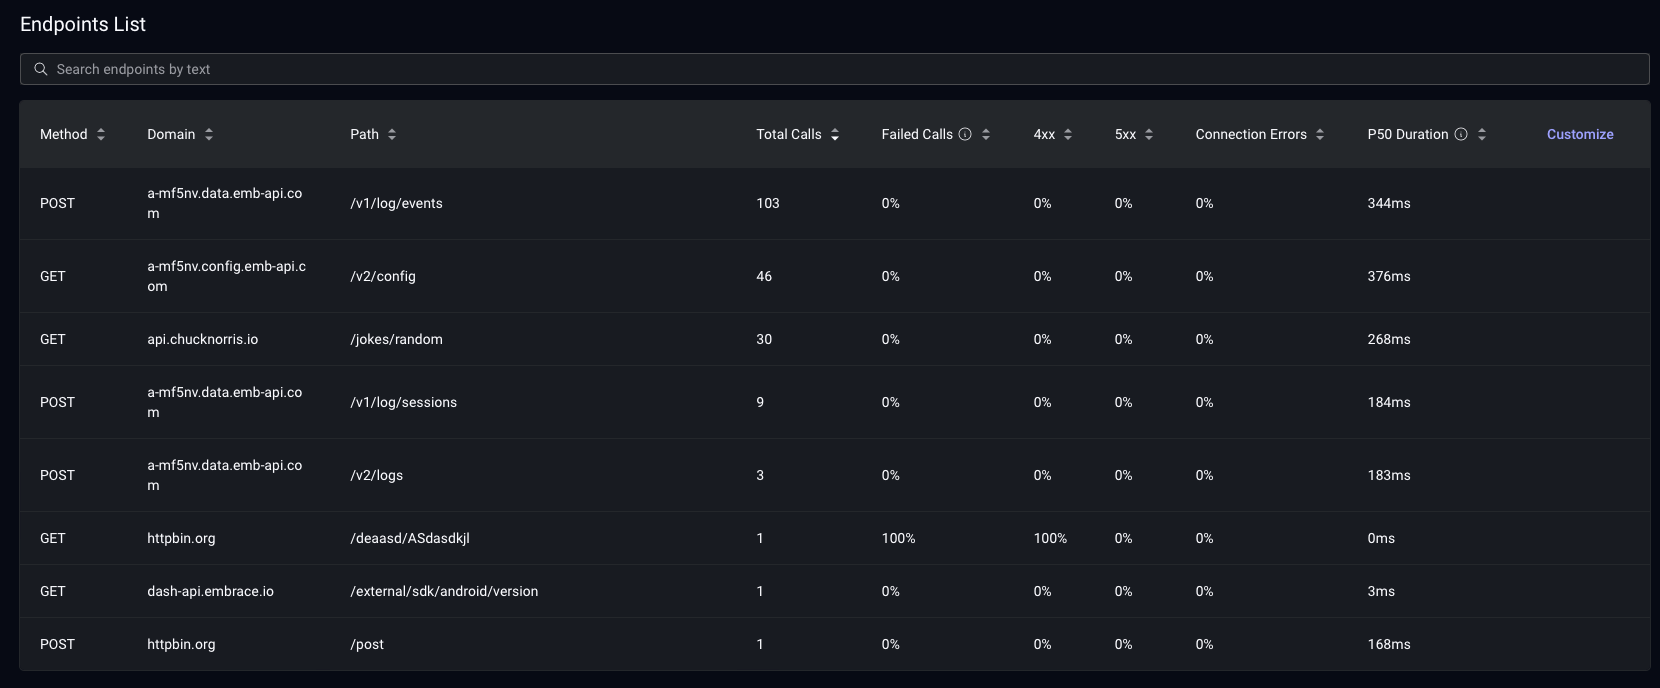
Endpoints List
This table presents a comprehensive list of all your network requests, organized by method, domain, and path. For each endpoint, you can view the average duration, number of requests, median duration, and error percentage. The table is sortable by each column, allowing you to quickly identify the slowest endpoints or those with the highest error rates. Use the search bar to locate specific endpoints efficiently.