performance monitoring
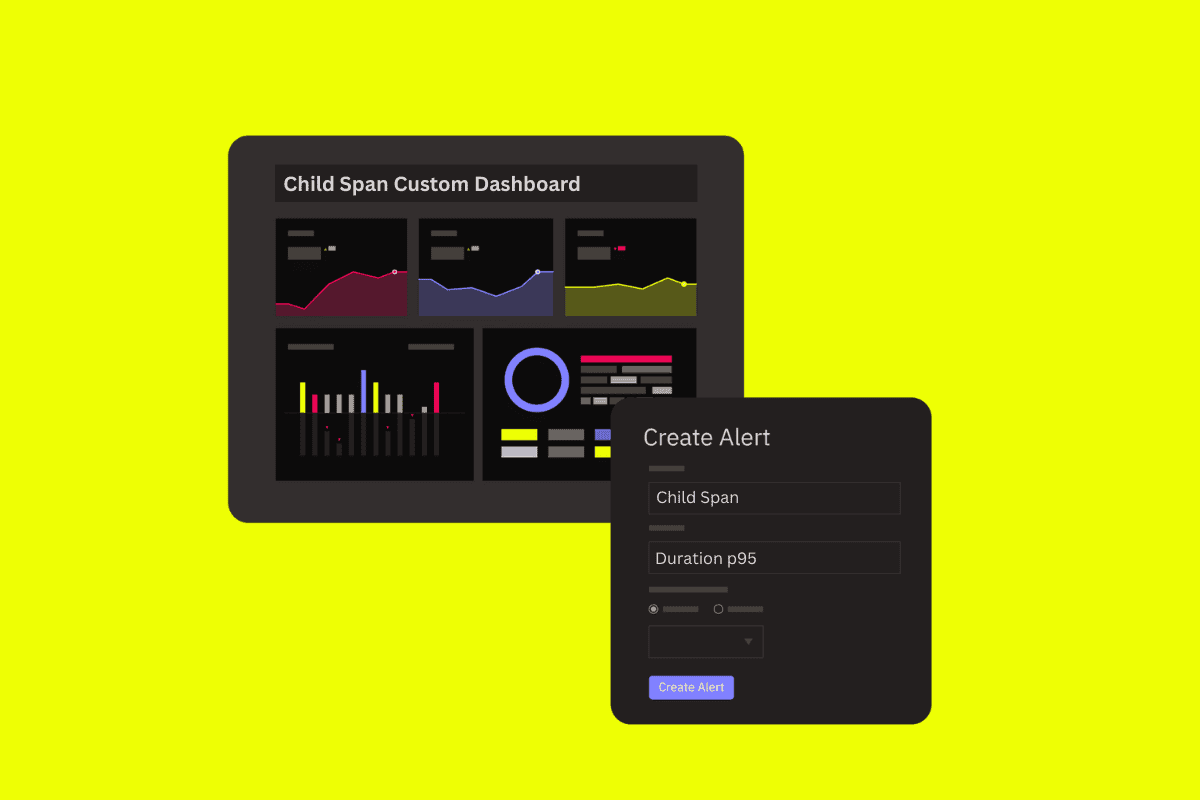
Embrace now supports custom aggregates using child spans, not just root spans. This includes creating custom metrics, custom dashboards, and alerts based on nested child spans, giving engineers the capability to do ultra-granular analysis and examine small (yet critical) operations in detail.
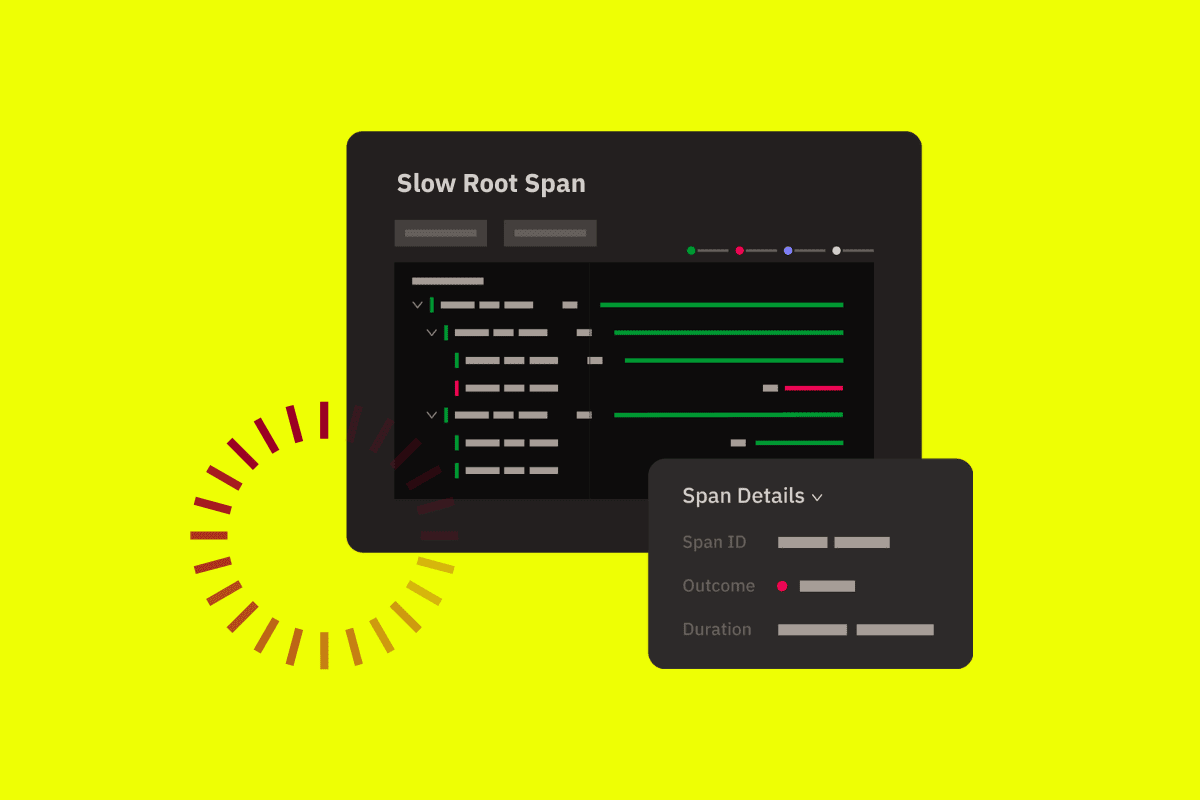
In complex applications, performance issues rarely live at the surface. The most telling details are often buried within layers of different operations, sitting inside child spans, the smaller, nested units that make up a complete transaction represented by a larger root span. Until now, those spans weren’t fully available for use in aggregate views, filters, widgets, or alerts.
That changes with Embrace’s latest release supporting more advanced capabilities for our tracing product.
We’re excited to announce that child spans are now supported wherever custom aggregates are used across the Embrace platform. You can now treat child spans as first-class citizens in your data analysis, enabling deeper insights, sharper monitoring, and more flexible alerting across your frontend and backend performance data.
Aggregated span data powers many of Embrace’s most valuable insights, from performance widgets and custom metrics to automated alerts. Previously, these aggregates were limited to root spans, leaving nested operations harder to analyze at scale.
But in practice, those child spans often represent the most critical work your app performs. These include things like rendering a UI component, fetching API data, or processing a specific asynchronous task. By extending aggregate support to all spans, not just root spans, you can now measure performance with the granularity your workflows demand.
With this product update, you can now:
Focus in on the spans that matter most. You can now filter dashboards or queries to include only child spans, giving you targeted visibility into specific operations within a transaction.
Not only can you use child spans for filtering, but they can now be the basis for their own custom widgets. Monitor key functions or endpoints directly from your dashboard, whether it’s tracking a specific UI render span, a network call, or something else granular yet critical.
Set up alerting conditions for any span type, now including nested child spans. For example, create an alert to monitor just your ui.render or db.query spans for latency regressions.
Aggregate performance data across all spans, not just root spans. That means you can track the success rate, latency, p50, p95, and other statistical metrics for highly granular operations nested within larger spans.


By extending custom aggregate support to child spans, Embrace continues to give engineering teams complete, flexible, and user-focused observability, from the top-level transactions all the way down to the smallest, most impactful operations.
Check out our docs pages to learn more about traces and spans in Embrace.
Ready to explore? Just log in to your Embrace dashboard to start building widgets, alerts, and metrics for every span in your system.
Not an Embrace user yet? You can get started for free here.
Get started today with 1 million free user sessions.
Get started free