WEBINAR Dec 16 | An OTel Carol: Past, Present, and Future of OpenTelemetry. Panelists discuss what OTel delivered in 2025, what improved, and what’s coming next.

Sign-up

Logs Forwarding is now available with Embrace

We're excited to extend our data forwarding capabilities to now include logs! Easily set up Logs Forwarding in the Embrace platform and start seeing high-context mobile logs in your OTLP-compatible observability backend of choice.

Embrace has provided data forwarding capabilities in various shapes and forms for our customers, from our queryable APIs to automatic forwarding to numerous Data Destinations. These integrations have provided our customers with the means to send metrics and traces to endpoints of their choice.

Now, we are excited to expand these capabilities to include the third pillar of the observability trifecta: logs. 

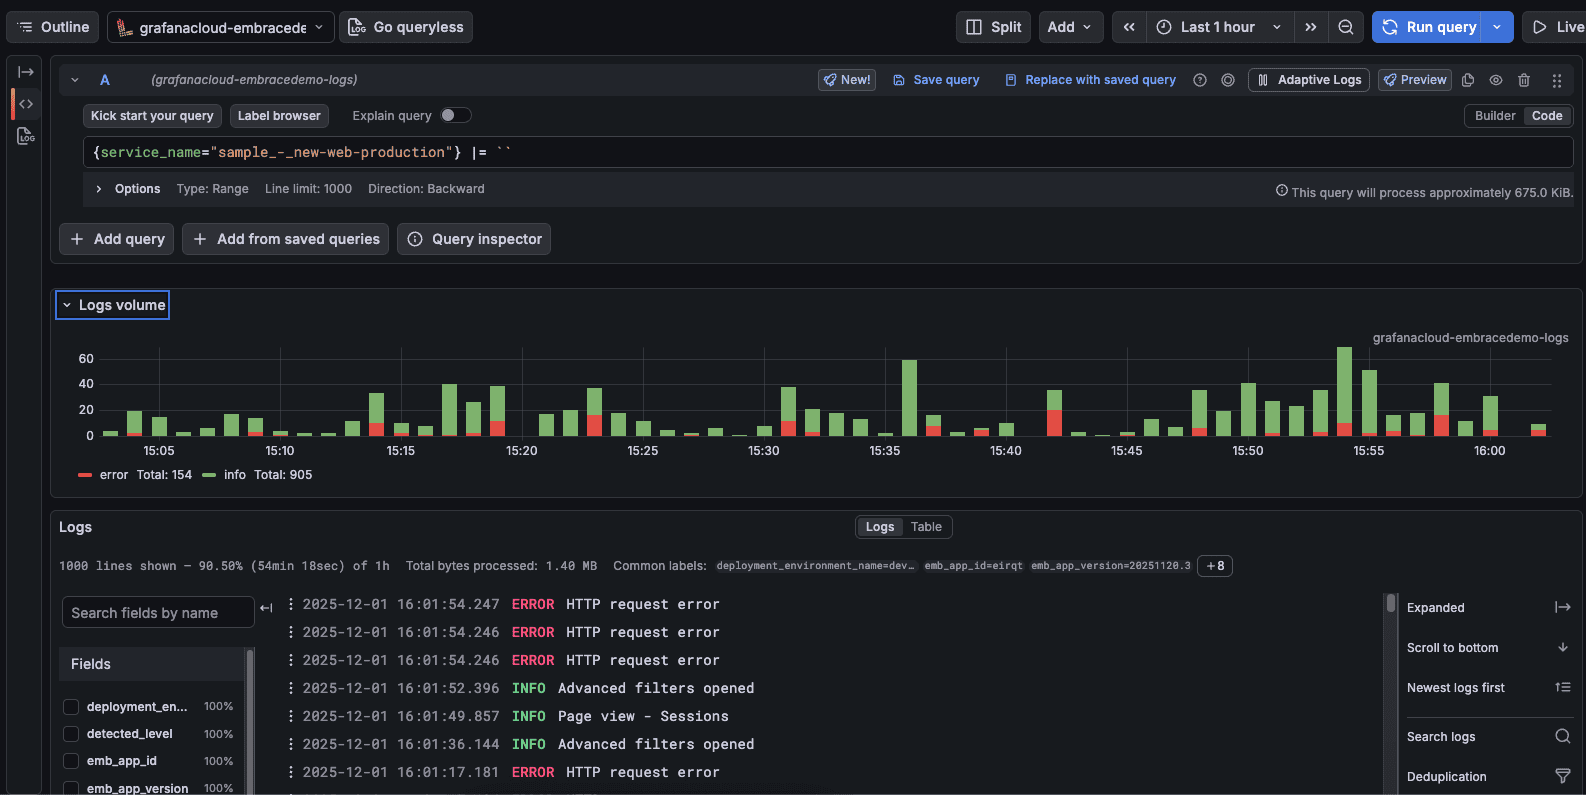
Logs Forwarding is now available from Embrace. This new capability lets you stream all logs captured by the Embrace SDK directly into your existing observability stack in real time using the OpenTelemetry protocol (OTLP).

That means your mobile logs can now live side-by-side with your backend logs in tools like Grafana Cloud, Datadog, Honeycomb, or any other OpenTelemetry-compatible platform you already use.

No more switching tools and no more blind spots – just cohesive, end-to-end observability.
Why Logs Forwarding matters

Until now, Embrace supported span forwarding via OpenTelemetry, but logs remained siloed inside the Embrace UI. While that worked for many workflows, it limited how teams could unify troubleshooting, alerts, and dashboards across mobile and backend systems.

With Logs Forwarding, Embrace becomes a first-class mobile logs source inside your broader observability ecosystem.

You can now:

  • See mobile logs alongside backend logs in one unified platform
  • Use your existing logging tools and workflows to debug mobile apps
  • Use logs as part of custom dashboards that combine mobile and server-side telemetry
  • Leverage advanced querying, alerting, and retention policies from your observability provider

If your team already lives in Datadog, Grafana, or Honeycomb for full-system observability, your mobile logs can live there too.

Under the hood

The new Logs Forwarding pipeline is powered entirely by OpenTelemetry Protocol (OTLP) and a new Embrace forwarding service built specifically for this purpose.

Here’s the high-level flow:

  1. Your app generates logs
  2. Embrace SDK captures the logs and sends them through the Embrace data pipeline
  3. Embrace evaluates your configuration to determine whether a forwarding destination has been assigned and acts accordingly
    Logs are streamed to your observability platform via OTLP in real time

This entire process is managed via Embrace’s Dashboard API configuration, giving you full control over where each application’s logs are sent.

Embrace logs shown in Grafana

Rich, structured metadata with every log

When logs are forwarded, Embrace enriches each record with consistent, structured metadata. This is aligned closely with the metadata already sent on network spans.

Each forwarded log includes:

Core log fields

  • Log message – The actual log content
  • Timestamp – When the log occurred
  • Severity level – Error, Warning, Info, or System

Key attributes

A list of additional attributes, consistent with those applied to forwarded network spans, are also included as metadata to forwarded logs. These include context into things like the application ID, the application version, the deployment environment, and the country / geography sending the log. These attributes make it easy to filter logs by different device or session properties, correlate logs with specific users or environments, and join logs with spans and traces for true end-to-end visibility.

For a full list of these attributes, please refer to our docs. 

What this unlocks for engineering teams

With Logs Forwarding now live, mobile teams gain the same level of operational maturity that backend teams have enjoyed for years. 

This includes capabilities like: 

Unified debugging: trace issues from mobile logs, to mobile spans, to backend traces, to backend logs 

Cross-platform dashboards: create customized, complex dashboards that combine things like mobile errors with API latency or infrastructure health 

Centralized alerting: trigger alerts when new events or patterns appear in your mobile data

Advanced querying and retention: take advantage of your backend platform’s query language on mobile logs, their data retention policies, and the ability to ensure cross-team visibility and governance.

Powered by OpenTelemetry, built to be interoperable

Logs in Embrace are exported using the OpenTelemetry Protocol (OTLP), meaning:

  • No vendor lock-in
  • Works with any OTLP-compatible backend’Consistent telemetry model across logs, spans, and traces
  • Future-proof observability architecture

This release continues Embrace’s commitment to open standards in user-focused observability. Your data stays fully portable and usable across your entire stack.

Get started with Logs Forwarding

If you’re already using Embrace, you can enable Logs Forwarding by configuring your log destination in the Embrace Dashboard API. Once configured, logs will begin streaming automatically in real time.

And if you’re new to Embrace, this is a powerful new way to bring mobile observability into the same workflows as your backend systems, without compromise. You can get started with a free account here.

Embrace Deliver incredible mobile experiences with Embrace.

Get started today with 1 million free user sessions.

Get started free
Related Content

Introducing log attachments for enhanced diagnostics

Logs are an invaluable tool for detecting and investigating all kinds of events in the application lifecycle. Sometimes, however, a standard record of a log is not enough. That's why we at Embrace have been working steadily to provide data enrichment features specifically for logs. The latest of these is our logs attachment capability, which allows engineers to attach different file types of up to 1 MB in size to log records, adding a layer of context for improved diagnostics and troubleshooting.