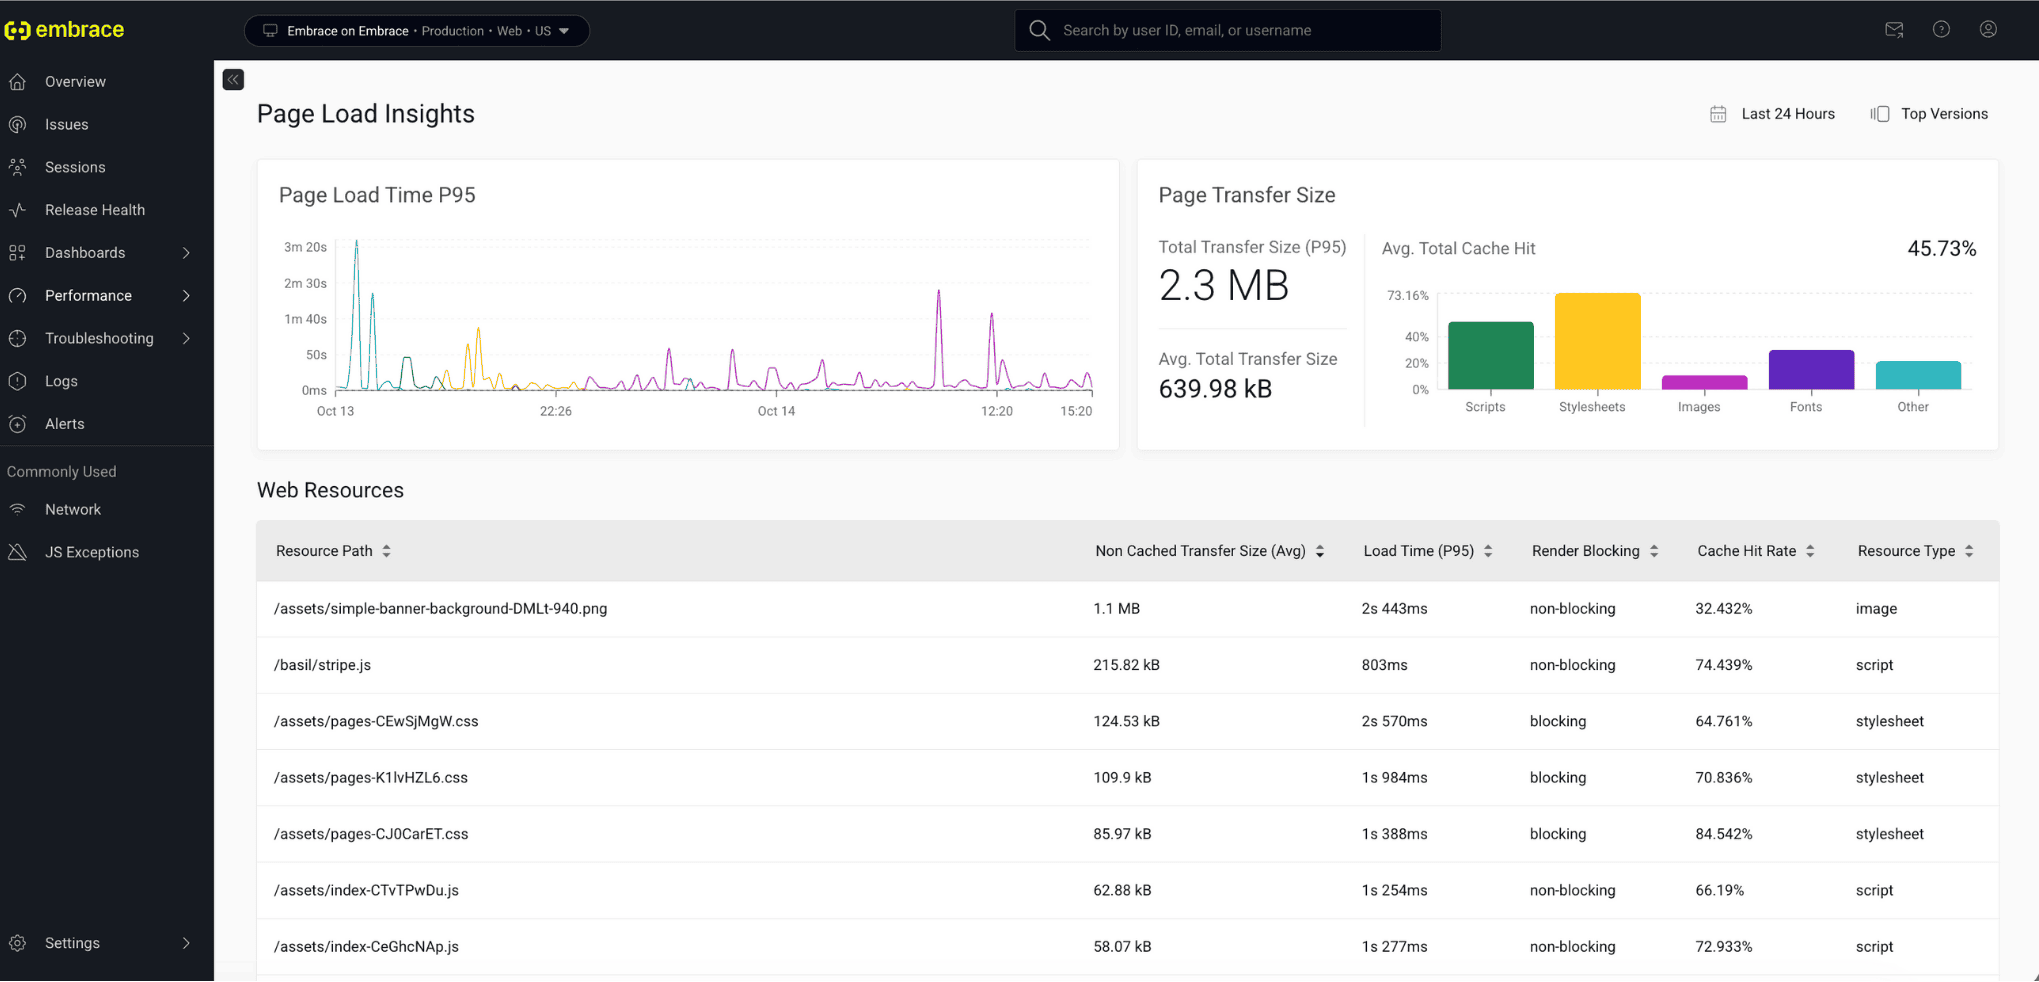
When it comes to web performance, every second matters. Your users don’t see “scripts” or “assets;” they experience pages that either load seamlessly or frustrate them with slowdowns. With our new Page Load Insights feature in the Embrace Web RUM dashboard, engineering teams can finally get a clear, resource-level view into what’s impacting page performance.
Introducing Page Load Insights in Embrace Web RUM

See exactly what’s slowing your pages down and impacting your end users with Embrace's new Page Load Insights feature for Web RUM.
Why visibility into page load performance matters

Page load time is one of the most important performance signals for web applications because it’s the first impression users have of your product. A fast, responsive page builds trust and keeps users engaged, while delays, even just a few hundred milliseconds, can cause frustration, abandonment, or even lost conversion opportunities.
The real impact of poor page load performance can be significant:
- A 1-second delay in page load can reduce conversions by up to 7%, according to research by Akamai.
- Faster-loading pages rank higher in search results, directly influencing discoverability and organic growth.
- In competitive industries like retail, travel, or media, speed is often the deciding factor between a completed transaction and a bounce.
But the challenge for engineering teams is that “page load time” isn’t a single number. Rather, it’s the result of dozens (or hundreds) of resource-level interactions happening during the initial user experience. Scripts, images, stylesheets, fonts, and third-party SDKs all contribute to page weight and render time.
Without clear visibility into those building blocks, teams are left guessing where bottlenecks originate.
That’s where Embrace’s Page Load Insights comes in. One of our latest Web RUM features, the Page Load Insights view gives engineers detailed, diagnosable, and fixable performance signals into their app’s initial load performance that directly maps to user satisfaction and business outcomes.
With this new feature, web developers will be able to use Embrace to easily answer questions like:
- Which specific images or scripts are bloating my page weight?
- Are my cache policies working as expected?
- Which resources are render-blocking and causing delays?
Read on to learn more about the new Page Load Insights feature and its capabilities.
What you get with Page Load Insights
Embrace’s Page Load Insights feature gives you both high-level stats into your website’s overall load performance, as well as detailed breakdown of all the individual page resources that are being fetched. This enables you to get both a quick pulse into your app’s health, as well as conduct deeper analysis into specific elements that might be at the root of rendering or cache issues.
Once on the Page Load Insights screen, you’ll see the following data about your web app:
P95 Page Load time tracking
With a P95 page load time tracking chart that refreshes in real-time, you’ll be able to immediately spot latency spikes. This helps you understand the slowest real-world experiences on your site, not just the averages.
Page transfer size breakdown
The Page Transfer Size panel gives you a breakdown of how much data is being delivered to your page, both on average and at the P95 level. This feature also gives you context into cache hit rates, allowing you to examine those rates by resource types: scripts, images, stylesheets, fonts, and more.
Resource-level diagnostics
After exploring high-level stats, you can dive deeper into individual resources by looking through the Web Resources table. The Web Resources table gives you detailed metrics into every resource your app loads, including:
- Non-cached transfer size
P95 load time in milliseconds - Render-blocking status (blocking or non-blocking)
- Cache hit rate percentage
- Resource type (script, image, font, etc.)
This makes it easy to immediately pinpoint individual heavy, slow, or uncached assets that are dragging down performance, and explore them further using Embrace’s high-context analysis tools.
The Embrace difference
Unlike sampled solutions, Embrace captures 100% of unsampled user sessions, giving you complete visibility into how real users experience your site. That means you’ll know exactly which resources affect performance and can prioritize fixes with confidence.
And because Page Load Insights is part of Embrace Web RUM, you can connect resource-level data to the broader picture: Core Web Vitals, JavaScript exceptions, user timelines, and more, all in one place.
Learn more about Page Load Insights and our other Web RUM capabilities by checking out our docs. When you’re ready, try it out for yourself by getting started with Embrace for free.
Get started today with 1 million free user sessions.
Get started free