We’re so excited to share our latest features and improvements to the Embrace dashboard!
In this post, we’ll give a walkthrough of updates to our ANR system. Embrace now groups ANRs by package so your team can quickly identify and measure the impact of first and third-party code on your ANR rate. We’ve also added powerful flame graphs for each package that highlight the lines of code that contributed to ANRs. With this update, your team has the most efficient solution for addressing the ANRs that hurt your business the most.
Here’s what we’ll cover:
- Why ANRs are so difficult to solve with Google Play Console data
- How Embrace provides better visibility by collecting every ANR
- How Embrace provides better ANR grouping by package
- How Embrace provides better ANR solving with flame graphs
Why ANRs are so difficult to solve with Google Play Console data
Mobile teams frequently rely on data from the Google Play Console to prioritize and solve the ANRs in their mobile apps. However, this leads to guesswork and frustration as the data provided does not provide enough context to understand the business impact or get to the root cause of a given ANR. You can read this post for a deeper dive into the problem, but we can think of the limitations loosely as:
- Lack of visibility into all ANRs: The Google Play Console underreports ANRs because it only counts an ANR when the user is prompted with a termination dialog after 5+ seconds of a frozen experience. When users abandon frozen apps before reaching the dialog, mobile teams do not have access to ANR data, which means they are blind to factors impacting churn and revenue.
- Unhelpful grouping methodology: The Google Play Console groups ANRs based on similarity of stack traces. Since these stack traces are taken long after the ANR started, similar stack traces can easily relate to entirely different initial conditions. This can cause mobile teams to invest significant effort into investigating ANRs without a clear path forward. In addition, unlike crashes, ANRs caused by the same underlying issue are not always attributed to the same exact line of code. This occurs because the time an ANR snapshot is taken will vary for each ANR.
- Insufficient data to solve ANRs: The Google Play Console only captures a single stack trace taken at the moment the termination dialog is shown. That means the stack trace frequently won’t reflect the actual execution state of the code when the freeze began. In order to solve why the mobile app froze, mobile engineers want to understand what code was running at the moment the app became unresponsive, not 5+ seconds later.
Let’s now cover how Embrace improves upon all these limitations with our ANR functionality.
How Embrace provides better visibility by collecting every ANR
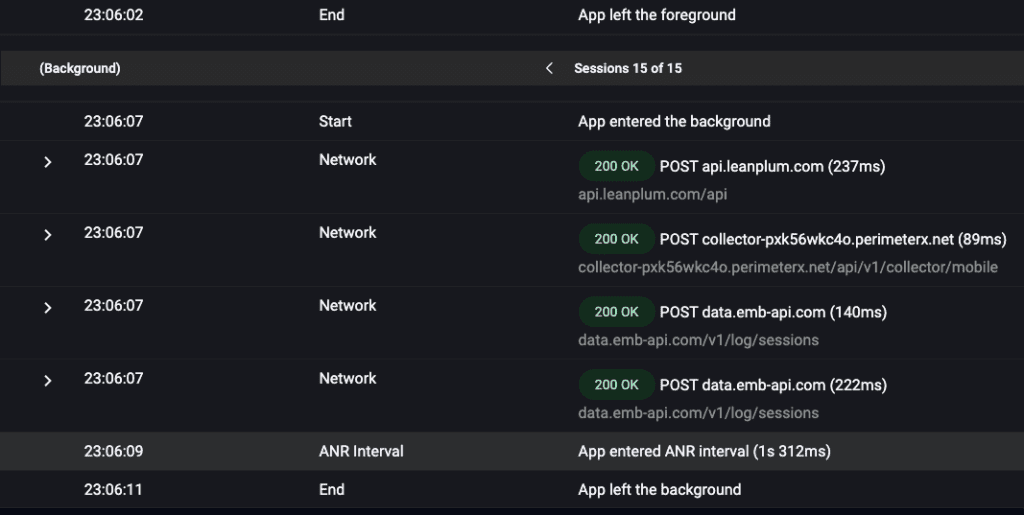
While not a new feature, it’s important to highlight that Embrace captures multiple stack traces for every ANR. Embrace captures a stack trace as soon as the main thread is blocked for 1 second and continues taking stack traces every 100ms until the ANR recovers or the termination dialog appears. This accomplishes several things:
- Mobile teams have access to stack traces that are taken much closer to when the ANR started.
- Mobile teams can investigate multiple stack traces throughout a single ANR’s duration, which allows them to understand how the code evolved throughout the ANR.

- Mobile teams have visibility into every type of frozen user experience. Teams have the data to address session-ending ANRs (i.e. the ones Google Play Console displays) in addition to shorter (and oftentimes more frequently occurring) ANRs that heavily disrupt the user experience but don’t result in app terminations.
Let’s now cover a new feature that provides a better grouping methodology for prioritizing ANRs.
How Embrace provides better ANR grouping by package
Instead of grouping ANRs by stack trace similarity, Embrace groups ANRs by package. This means we scan every ANR stack trace, and if a package appears in any of the lines, we group it under that package. By broadening how we group ANRs, mobile teams can understand at a high level which sections of code are more likely to be contributing to ANRs. For example, if a third-party package, e.g. an ad SDK, appears frequently, you can provide the vendor with the data they need to understand what needs to be fixed. Likewise, if an internal package is causing ANRs, you can notify the appropriate owners to investigate the issue.
Updated ANR summary page
The following image is from our updated ANR Summary page. You can see top-level metrics like ANR-Free Sessions and ANR-Free Users with breakouts by version.

Below that, we’ve added our grouping by package, where you can examine the impact in a few ways:
- Percentage across all stack traces – Out of all ANR stack traces, this measures the percentage that have a line with the given package. You can think of this loosely as the relative frequency of this package among all ANRs. This is not technically correct because multiple packages can appear in the same ANR stack trace, but it will serve as a useful mental model.
- Percentage across all user sessions – Out of all user sessions, this measures the percentage that have an ANR stack trace that contains the given package.
We normalize this data by looking at the total percentage of ANRs by package across stack traces and sessions. Otherwise, by solving one ANR, the relative percentage of stack traces will make it seem like another ANR is getting worse.
You can also filter down to view ANR data based on the attributes and packages you’re interested in. The current options include the following:
App
Build
Environment
Device
Country
Model Factory Name
Manufacturer
OS
OS Major Version
OS Version
User
Persona
ANR
Package Name

This filtering allows teams to isolate the impact of specific ANRs in many different ways, including across users, OS versions, countries, and devices.
New ANR Stats Page
You can click the “Explore ANR Stats” button to be taken to our new ANR Stats page, where you can examine the distributions of all ANRs across several attributes, including device, OS version, country, and time of day (in UTC).

Here’s a quick primer on how to interpret this information:
- The blue line represents the proportion of total ANRs that occurred with the given attribute.
- The gray line represents the proportion of total sessions that occurred with the given attribute.
Large differences between the two lines indicate ANRs being over- or under-indexed by that attribute. These visualizations provide context about where ANRs might disproportionately affect subsets of your users. In extreme cases, ANRs that overwhelmingly affect a given attribute can guide your team towards a possible root cause involving that attribute.
How Embrace Provides Better ANR Solving with Flame Graphs
In order to solve ANRs, mobile engineers need to get as close as possible to the code that triggered them. We’ve covered how inspecting isolated stack traces can present misleading or incomplete information. In addition, prioritizing the ANRs to solve becomes a near impossible task when facing thousands of stack traces that vary greatly in perceived similarity.
In an ideal world, mobile engineers want to know the following:
- What are the most common code paths that lead to ANRs?
- Which ANRs should we solve to provide the largest gains to the business?
- How can we uncover the root cause of a given ANR without wasting time and engineering resources?
Introducing Embrace’s solution: ANR flame graphs!

If you are unfamiliar with flame graphs, you can check out this helpful post by Brendan Gregg for a quick primer. Essentially, they are a way to visualize hierarchical data, most commonly used with data that contains stack traces (e.g. visualizing CPU profiler output).
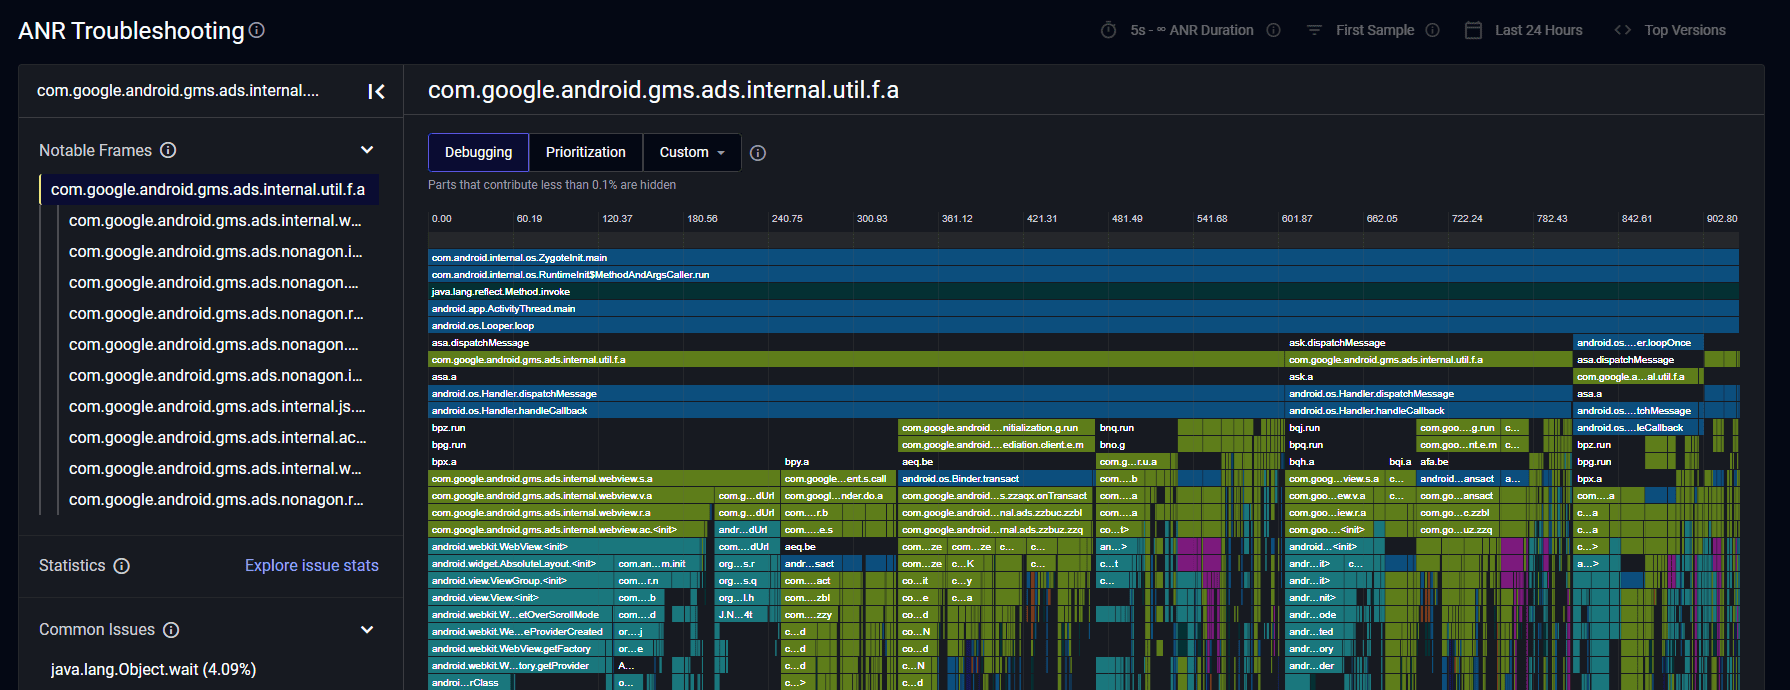
Here’s how Embrace’s flame graphs work. From each ANR interval that occurs, Embrace will inspect the stack trace that corresponds to the selected grouping. The current grouping options are First Sample (i.e. the first stack trace captured once the ANR begins) or Last Sample (i.e. the final stack trace captured at the end of the ANR). If the stack trace contains a line with the selected package, it is used in the flame graph.
Embrace combines these ANR stack traces into a single flame graph to visualize the most common paths in the stack traces. So instead of sifting through each individual stack trace to see if it is relevant, you can use this aggregated view to summarize what paths are the most common. In interpreting the flame graph, keep in mind that each vertical slice represents a stack trace that was collected for an ANR.
Here are a few tidbits that will help in understanding these flame graphs:
- The flame graph can contain at most one stack trace – either the first or the last – from a given ANR interval. While Embrace collects multiple stack traces for ANRs and displays them in User Timelines, incorporating every stack trace into the flame graphs would lead to noise. These flame graphs are more actionable when they represent the state of your code when ANRs either begin or end.
- The flame graph contains every desymbolicated stack trace that has the selected package in at least one line.
- The x-axis represents the frequency a given line in a stack trace occurs (sorted in descending order). In other words, the wider an entry is, the more often that function call appears in that exact line among all stack traces. It is helpful to remember that there is no time component in flame graphs. The grouping is done by commonality and not by time of capture.
- The y-axis represents the execution path of a given stack trace.
Here are a few tips for what to look for in a flame graph:
- The wider and deeper a block of the same lines are, the more frequently that code path contributed to an ANR.
- Finding a common line that branches into several distinct points could indicate a possible root cause.
- The same function call will happen in many different lines. By comparing the lines before and after these instances, you can get a sense of how deterministic that call is in relation to the ANR.
Remember that above all else, these flame graphs are meant to visualize a given package’s impact across ANRs. Not every package will have immediately obvious results. If a flame graph has very few dominant patterns, it’s a good indication of many distinct root causes.
You access this functionality by clicking on a specific package from the ANR Summary page. Each flame graph is calculated based on all the stack traces that contain the given package. In addition, the filters you’ve applied in the previous page will carry over, and you can add/remove filters here as well.
And that’s it! We’ve redesigned our ANR system to provide the most actionable data to prioritize and solve the ANRs that have the largest business impact. Embrace collects multiple stack traces for every ANR so your team has full visibility across every type of app freeze and how the code evolved throughout their duration. Embrace groups ANRs by package so your team can quickly identify and measure the impact of first and third-party code on your ANR rate. Finally, Embrace creates flame graphs for each package that highlight the lines of code that contributed to ANRs.
We’re excited to learn how this new ANR functionality helps you identify, prioritize, and solve ANRs faster than ever before. As always, please share any feedback so we can continue to build features and improvements that help your team be successful.
How Embrace helps mobile teams
Embrace is a data driven toolset to help mobile engineers build better experiences. We are a comprehensive solution that fully reproduces every user experience from every single session. Your team gets the data it needs to proactively identify, prioritize, and solve any issue that’s costing you users or revenue.
Want to see how Embrace can help your team grow your mobile applications with best-in-class tooling and world-class support? Request a demo and see how we help teams set and exceed the KPIs that matter for their business!


