WEBINAR on JULY 14 | Honeycomb + Embrace: How to Close the Gap Between Frontend Experience & Backend Truth

Register now

Embrace and Honeycomb: Connecting user experience to backend truth

With Embrace and Honeycomb, you can connect user sessions to backend traces, so every investigation carries its evidence across the stack, not just to its edge.

Production issues rarely stay in one layer of the stack.

A drop in checkout completion might look like a mobile problem until the session timeline points to a failing backend request. A slow endpoint might look like a backend issue until you realize it only affects one app version. A Core Web Vitals regression might sit below alerting thresholds for weeks while real users quietly feel the drag.

That is where teams lose time. Not because they lack data, but because the data lives in separate tools, shaped for separate teams, with just enough missing context to slow down every handoff.

Embrace and Honeycomb are working together to close that gap.

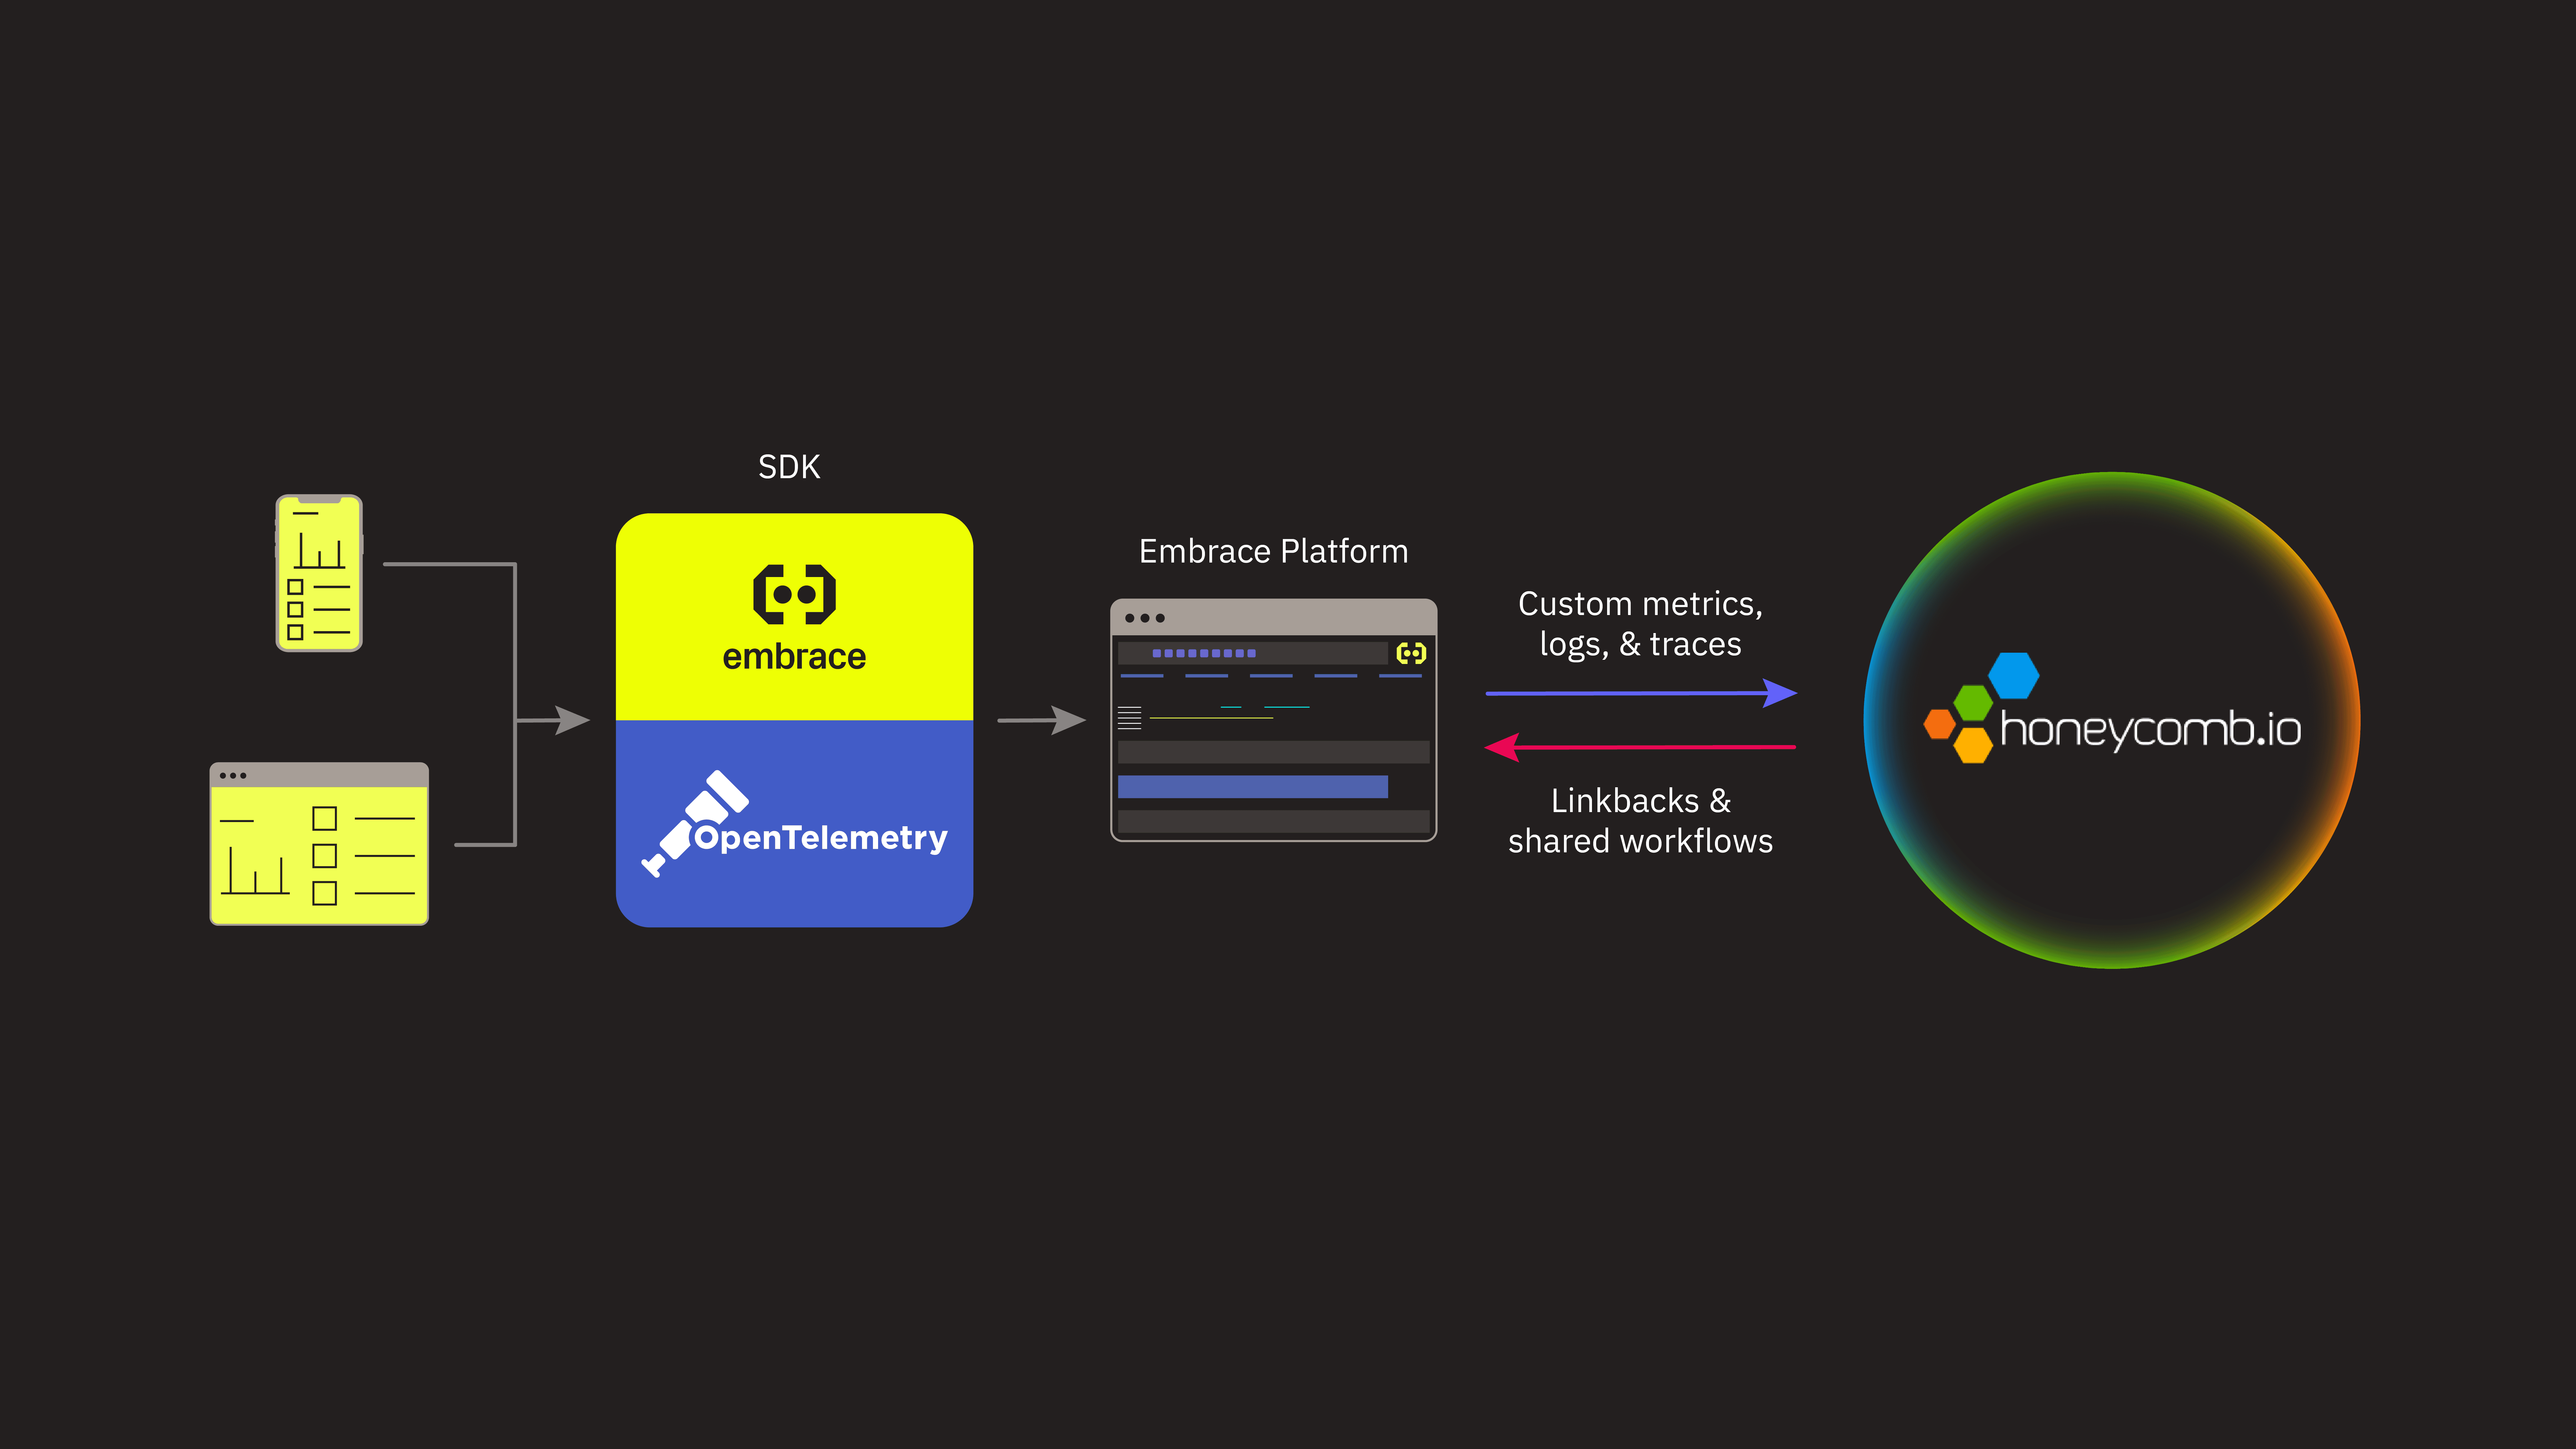
Honeycomb gives teams deep backend observability, high-cardinality querying, and distributed tracing for complex production systems. Embrace gives mobile and web teams a user-centered view of app performance: sessions, screens, taps, crashes, app hangs, ANRs, network requests, Core Web Vitals, exceptions, and the timeline of what actually happened to a user.

The integration connects those views through OpenTelemetry and W3C trace context, so teams can move between frontend experience and backend behavior without the need for manual stitching together of timestamps, request IDs, screenshots, and user reports by hand.

SREs, backend engineers, mobile engineers, and frontend teams often start investigations in different places because they are answering different first questions.

The goal is simple: Make the handoff faster, cleaner, and more useful. Today, I’ll show you three specific use cases for uniting frontend performance with backend reliability.

Embrace SDKs collect telemetry from mobile and web applications across Android, iOS, web, React Native, Flutter, and Unity. That telemetry includes user sessions, network requests, exceptions, crashes, app hangs, ANRs, performance data, and other frontend signals that explain what users experienced before, during, and after a problem.

Teams can configure Honeycomb as a data destination in Embrace using their Honeycomb API key. Once connected, Embrace can forward key telemetry into Honeycomb, including custom metrics such as session counts, span counts, network request volume, exceptions, durations, and other performance indicators.

That gives Honeycomb users a way to see frontend and user-experience trends alongside backend service behavior.

Metrics help teams understand the shape of a problem. Traces help them understand the cause.

Embrace forwards network spans with W3C trace context, allowing frontend requests to connect with backend spans in Honeycomb. When the backend is also instrumented, Honeycomb can show the larger distributed trace: the services involved, the dependencies touched, and the timing details behind the request.

Embrace also adds the context Honeycomb does not naturally have on its own: the user session.

Network spans forwarded from Embrace can include links back into the Embrace platform, where teams can inspect the full session timeline, related requests, user actions, device details, and broader cohort impact.

Instead of seeing only that a request was slow, teams can see what the user was doing when it slowed down, who else was affected, and whether the problem was isolated or widespread.

That context matters because the hardest part of incident response is often not finding a signal. Instead, it is knowing how much to care, who should own it, and what evidence they need to take action.

When the SRE starts in Honeycomb

Use case 1: An SRE traces a slow endpoint to real user impact.

For SREs and backend teams, Honeycomb is often the natural starting point.

An on-call engineer investigating a slow service can use Honeycomb to narrow the issue to a specific endpoint, traffic slice, region, deployment, or dependency. That backend truth is critical.

But backend truth is not always user truth.

A slow endpoint may be noisy but harmless. Or it may sit directly in the path of a revenue-critical flow. It may affect a single customer, a specific app version, a particular mobile OS, or a broad population of active users.

Without user session context, the SRE still has to answer the impact question manually.

With Embrace telemetry in Honeycomb, the path is clearer. An Embrace user session link can take the engineer directly from a backend trace to the related user session in Embrace.

Use case 1: An SRE looks into the real user session using the Embrace User Session Timeline.

From there, they can see what the user was doing, which app version they were on, what device and OS they used, and whether similar sessions show the same pattern.

In this investigation Honeycomb helps isolate the backend behavior and Embrace shows the user impact.

Together, they turn “this endpoint looks slow” into “this endpoint is slowing checkout for users on version 8.4.1, and here is the session evidence.”

That is a much better handoff.

When the mobile engineer starts in Embrace

Use case 2: A mobile engineer connects a checkout drop to a backend failure.

Mobile engineers usually start from the user side of the story.

They are not looking at a service map first. They are looking at an experience that changed.

Maybe an Embrace alert fires because checkout completion dropped 30% over the last few hours compared to the expected baseline. That alert is not just saying something is slow, something crashed, or a few users had bad sessions. It is saying users are no longer making it through a business-critical path at the rate they normally do.

The engineer opens Embrace and starts with the affected user flow. They can see where users are dropping: perhaps they reach the payment screen, tap submit, and never make it to confirmation. They can break the issue down by app version, device, OS, geography, and release window to understand whether it is broad or concentrated in a specific cohort.

From there, they can jump into failed sessions. The session timeline shows what happened in order: screens visited, actions taken, network requests fired, errors encountered, and how long each step took.

Use case 2: In the User Flow Completion dashboard, engineers can see where users stop completing specific flows and investigate why using the Embrace and Honeycomb integration.

They can notice the same pattern appearing across failed sessions. For example, users are waiting on the same order confirmation request, receiving a 500, or timing out after submitting payment. With this context, the investigation shifts from, “Is the checkout UI broken?” to “What happened downstream when this user tried to complete the flow?”

That is where the Honeycomb integration makes the handoff stronger.

Because Embrace forwards network spans with W3C trace context into Honeycomb, the mobile engineer can take the trace ID tied to the failed checkout step and open the matching backend trace. Instead of filing a ticket that says, “Checkout completion dropped and users seem stuck after payment,” they can attach the specific trace, affected endpoint, app version, session context, and user-flow impact.

The backend team can then see whether the request hit a slow dependency, unavailable service, regional timeout, retry loop, or error path. The mobile engineer stays grounded in the user journey. Honeycomb shows what happened after the request left the device. Asking a simple question to Canvas AI, with context on the issue allows it to do a first triage investigation of what the problem possibly could be with checkout.

Use case 2: An SRE chatting with Honeycomb Canvas AI to investigate possible backend root causes for the checkout completion drop.
Use case 2: Canvas AI surfaces a client timeout issue as the culprit.

The result is a faster answer to the question that matters during an incident: Are users failing because of something in the app, or because the app is waiting on a backend path that is misbehaving? In this case, the issue stemmed from the client continually timing out while trying to reach the Product Catalog Service, which prevented users from successfully completing checkout.

The integration helps teams avoid debating ownership. When the problem is client-side, Embrace helps prove it. When the problem is downstream, Honeycomb helps prove that, too.

When frontend performance degrades slowly

Use case 3: A frontend engineer validates a Core Web Vitals regression end to end.

Not every issue announces itself with a crash spike or a page.

Some of the most expensive user-experience problems creep in slowly, especially on the web. A Core Web Vitals metric might drift in the wrong direction for a month without crossing a hard alert threshold. Nothing is technically on fire, but users are feeling the drag.

A frontend or web performance engineer might first notice the trend in Honeycomb. Maybe INP is getting worse on a key page, or LCP has regressed for a specific traffic segment. The aggregate view is enough to raise suspicion, but it may not explain whether the problem is happening in the browser, on the network, or behind a backend service.

Embrace adds the user-centered view: which pages are affected, which interactions feel slower, which browsers or devices are overrepresented, and what users were doing when the delay appeared. Session timelines and synthetic monitoring can help isolate likely frontend causes, such as a recently shipped vendor SDK, a blocking script, a heavier page element, or a new interaction pattern that puts more work on the main thread.

Honeycomb answers the next question: Did anything downstream contribute?

Using network spans from Embrace and connected backend traces in Honeycomb, the engineer can inspect the services involved in the slow page or interaction. If backend latency, errors, retries, and third-party dependency timing are flat, that is strong evidence the regression is likely client-side. If slow sessions correlate with a specific API route, region, cache miss, feature flag service, or dependency, then the frontend symptom has a backend lead.

That matters after the fix ships, too.

Embrace can show whether real user sessions and Core Web Vitals improved. Honeycomb can validate whether production behavior changed the way the team expected. If the fix removed a vendor SDK call, Honeycomb should show fewer requests from that page path. If the fix reduced backend fan-out, traces should get shorter. If the team believed a backend dependency was not responsible, Honeycomb can confirm that backend latency and error rates stayed flat while the user experience improved.

Honeycomb dashboard built using Embrace web metrics

Together, Embrace and Honeycomb help teams prove what changed, where it changed, and whether the fix addressed the right layer of the stack.

The value is the handoff

The goal of this partnership isn’t to expand the number of tools a team monitors, it’s to reduce the friction between the ones they already depend on.

An SRE narrowing down a slow endpoint in Honeycomb shouldn’t have to guess whether real users felt it. A mobile engineer watching checkout completion drop shouldn’t have to file a ticket and wait to find out what happened downstream. A web engineer chasing a slow INP regression shouldn’t have to argue about whether the problem is in the browser or behind a service. Now each of those investigations carries its evidence across the boundary instead of stopping at it.

That’s the real shift: not more visibility, but fewer handoffs that lose context. Honeycomb stays strong in backend systems. Embrace stays strong in the user session. The trace ID, the W3C context, and the session links let one pick up exactly where the other leaves off, so the question stops being “Whose problem is this?” and becomes “Here’s what happened, end to end.”

If you’re already using Embrace, you can connect Honeycomb as a data destination and start forwarding metrics and network spans today. If you’re coming from the backend side, the same trace context that powers your distributed traces is what links them back to the sessions behind them.

Most teams already have enough telemetry. What they lack is continuity between the layers that hold it. Connecting Embrace and Honeycomb means a single investigation can move from user session to backend trace without losing sight of the real problem.

To learn more, sign up for our upcoming live session where we’ll demo how your team can use Embrace and Honeycomb to close the gap between frontend experience and backend truth.

Embrace Deliver incredible mobile experiences with Embrace.

Get started today with 1 million free user sessions.

Get started free