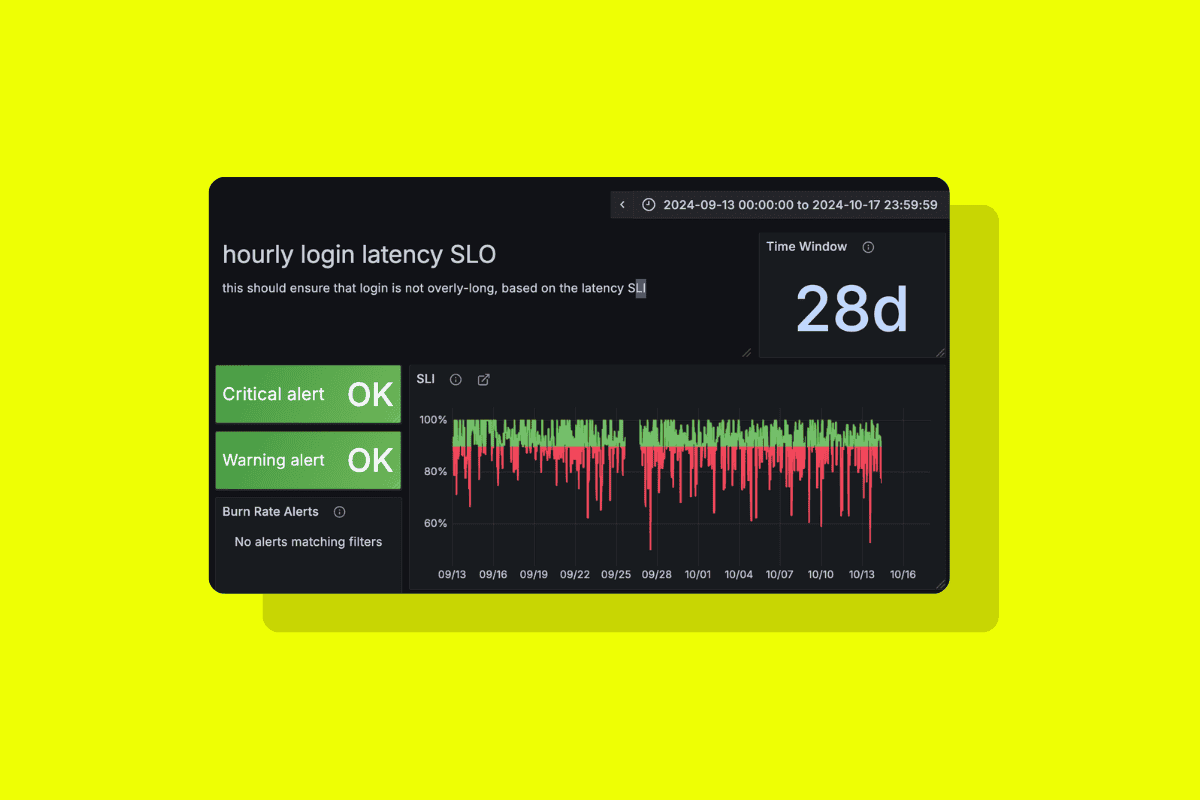
We know many of our customers love visualizing their critical mobile observability data from Embrace directly within their Grafana dashboards. It’s a powerful way to see key metrics and trends alongside other system data.
But what happens when you spot something interesting – an anomaly, a spike, or a dip – in your Grafana chart and need to investigate the underlying data within Embrace?
Previously, this meant manually navigating to Embrace and trying to recreate the context of your Grafana view.
With our latest update on the Embrace + Grafana integration, this process just got a whole lot easier.
You can configure deep link capabilities in your Grafana instance that are powered by APIs feeding in data from a specific source. Now, Embrace is one of those supported data sources in your Grafana instance.

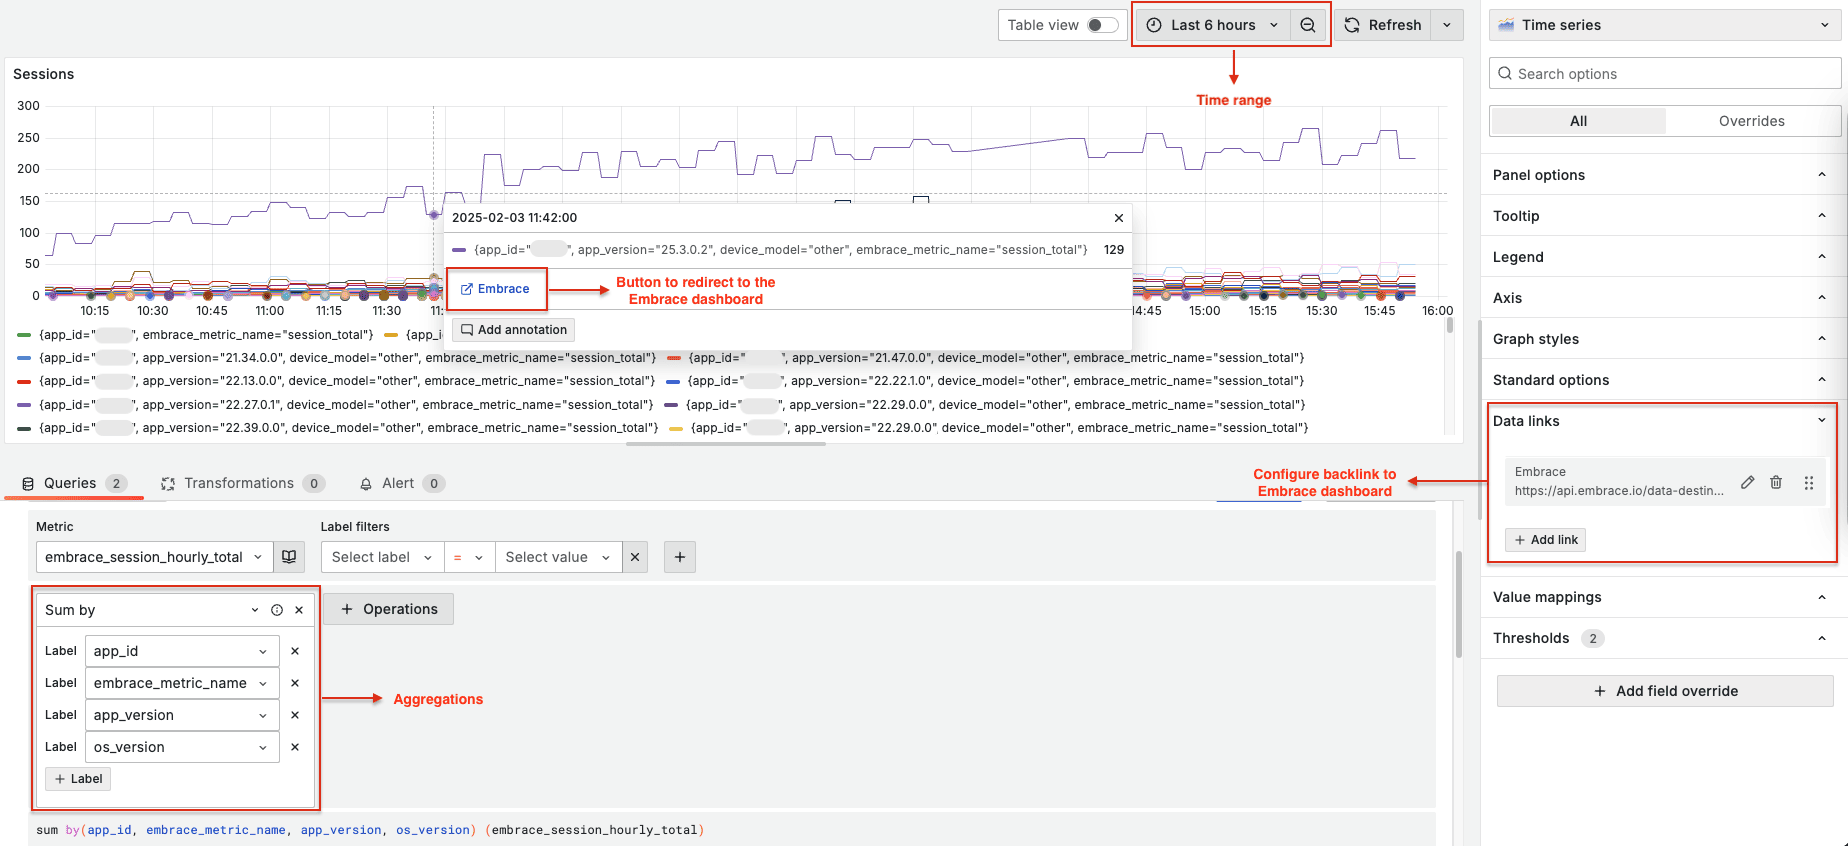
That means you can seamlessly navigate from Embrace data in a Grafana dashboard to the corresponding data in your Embrace dashboard. In Embrace, you have advanced analysis tools specialized for mobile to further interrogate this data.
For example, you may be forwarding metrics from Embrace to your Grafana instance to create visualizations, alerts, or power your SLOs. If any of those mobile metrics look off, you can seamlessly go from your Grafana dashboard right to the relevant data in your Embrace dashboard with just a single click. That way, you don’t have to waste time trying to find the right exemplar in Embrace to troubleshoot a potential SLO violation or alerts spike.
That’s because the back-link is precise and context-aware. The destination within the Embrace dashboard depends on the metric being visualized. For example, if the metric represents session data, clicking the link will redirect you directly to the Sessions page in Embrace.
The data link also preserves the selected time range from your Grafana view. If the time range in Grafana is specified in a relative format (like “Last 12 hours”), it will be converted to absolute time stamps in Embrace
It also preserves some supported aggregations that may be active in the Grafana visualization where the data link is configured. For instance, if your metric is aggregated by operating system version and country, Embrace will recognize and save those aggregations as filters when presenting the corresponding data for your in the Embrace dashboard.
Get started today with 1 million free user sessions.
Get started free