NEW REPORT! Defining and measuring mobile SLOs: Best practices for modern DevOps, SRE, and mobile teams

Download report
grafana

Embrace and Grafana Labs: Bringing the mobile app into your modern observability solution

Enable full-stack observability with unparalleled visibility into mobile user experiences.

Embrace and Grafana Labs have teamed up to connect mobile experiences to your full-stack observability solution. Embrace captures context-rich client telemetry for mobile apps and can deliver metrics, traces, and soon logs to your Grafana dashboard. With features built on the common language of OpenTelemetry, you can weave together a complete story from button taps and push notifications to issue detection and performance.

Enable full-stack observability with unparalleled visibility into mobile user experience.

The benefit? Your observability stack might be missing the user. Uptime might be great, and performance and backend SLIs within the realm of acceptable, but customer impact is a complete blindspot. The only way to ensure that your team is capturing the critical workflows – to proactively make sure your app “works” – is to link what happens in the user’s hand to what you track in a dashboard. Bringing the two together into one picture means you can solve critical issues before they happen.

How does Embrace work?

Embrace gets all the important signals of user, app, and device activity for your mobile application. Capture broad contextual events like sessions and ANRs, and build your own user flows using performance tracing to track what’s important, like authorization and payments. This telemetry is all captured as OTel-compliant traces and logs on the mobile client, and stitched together to give a complete picture of the user’s experience.

From the User Timeline, developers can see the user’s entire journey and all the supporting technical details. Their button taps, network requests, and crashes are all automatically visible when you install the SDK.

Additionally, by instrumenting your app with tools like breadcrumbs and performance tracing, you can track important moments in time and user flows that are specific to your app. What might a user flow look like?

A trace full of spans! Using Embrace’s tracing instrumentation on iOS and Android, you can add context to any part of the user experience. Uniting spans across disparate parts of the app sessions into a trace allows you to measure the duration and effectiveness of your user flows, and to see where users, or you, might have gone wrong.

Finally, all this information can be aggregated within Embrace as metrics. In the Embrace dashboard, there are automatically-generated Standard Metrics that are useful for most apps. Additionally, you can aggregate most of our signals into Custom Metrics for scenarios that might only happen in your very specific user experience:

This data is helpful for a mobile engineer, but engineering teams struggle to unite user-focused mobile performance data with backend observability. They want a common language to improve end-to-end workflows and better understand issues that affect SLOs and the success of your application. How can you bridge the gap between mobile and backend observability?

Linking Embrace and Grafana

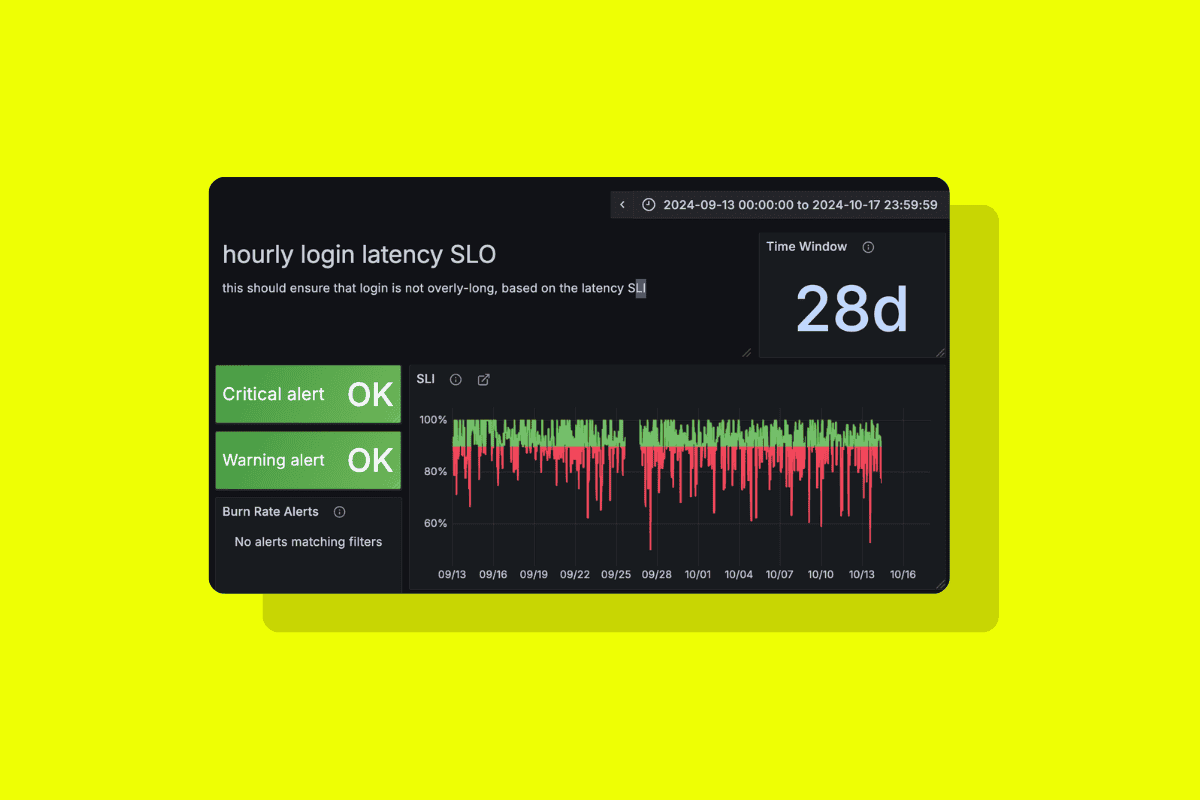
The metrics and traces that Embrace collects and generates reflect an important layer of your application stack: the end user experience. To make users a visible, measurable part of your successful application, you should send these signals to your single pane of glass in Grafana.

Your mobile metrics let you peek into latency of requests, poorly-integrated frameworks, and other parts of your application that might lead to poor user experience and churn. Seeing these metrics in Grafana can be as simple as pressing a couple buttons in Embrace. By activating Grafana as your Data Destination, you can forward Standard and Custom metrics directly to Grafana:

If you want further-refined metric data, you can also query the Embrace data through our Metrics API. Using PromQL, you can create queries for precisely the data that you’re looking for:

// Sample PromQL query using Node
const prom = new promQuery.PrometheusDriver({    
    endpoint: METRICS_API_ENDPOINT,    
    baseURL: "/api/v1",    
    headers: {Authorization: AUTH_HEADER},    
    preferPost: true
});

// Query a 24 hour period with an hour step
const end = new Date(new Date().toUTCString()).getTime();
const start = end - 24 * 60 * 60 * 1000;

// Get list of available metrics
prom.labelValues("__name__","", start, end)    
    .then((res) => {        
        console.log('[metrics] Metrics:');        
        console.log(res);        
        console.log("\n");    
    }).catch(console.error);
const fetchData = (query, start, end, step) => {    
    prom.rangeQuery(query, start, end, step)        
    .then((res) => {            
        const series = res.result;            
        series.forEach((serie) => {                
            console.log("Series:", serie.metric.toString());                
            console.log("Values:\n" + serie.values.join('\n'));            
        });        
    })        
    .catch(console.error);
};


To drill down into the details of user experience in your single pane of glass, you can also forward traces to Grafana. Embrace has a Spans API similar to the Metrics API, which allows you to build queries and find the oversized payloads that slow down your networking, or the slow navigation that leads users to stop in a purchase flow. The Spans API is built on TraceQL to connect traces to Grafana Tempo:

Finally, Embrace integrates directly with Grafana to paint the entire picture of network requests using Embrace’s Network Span Forwarding. Tying together the client’s request and your web service, you can go from any failed network call to the affected session. In the end, a single, multi-system trace ties the mobile experience to the services that support it.

Conclusion

Embrace’s mobile telemetry and the flexibility of Grafana Cloud’s dashboards let you see and solve the mobile user experience as part of your business’s goals. With OTel concepts like metrics and traces, you can braid together telemetry to power observability that is as complex and useful as the application you’ve built. Tackling the “unknown unknowns” that pop up across a system requires the right approach to collecting signals, and with Embrace and Grafana, you’ve got a head start.

Embrace Embrace + Grafana Labs

Modernize your mobile observability with full-stack visibility based on OpenTelemetry.

Learn more

Build better mobile apps with Embrace

Find out how Embrace helps engineers identify, prioritize, and resolve app issues with ease.