A key measure of any Android app’s quality is responsiveness. In fact, Google cares so much about non-responsive Android apps that it will actively punish developers that don’t meet their standards, by making their apps less visible in search and within the Play Store.
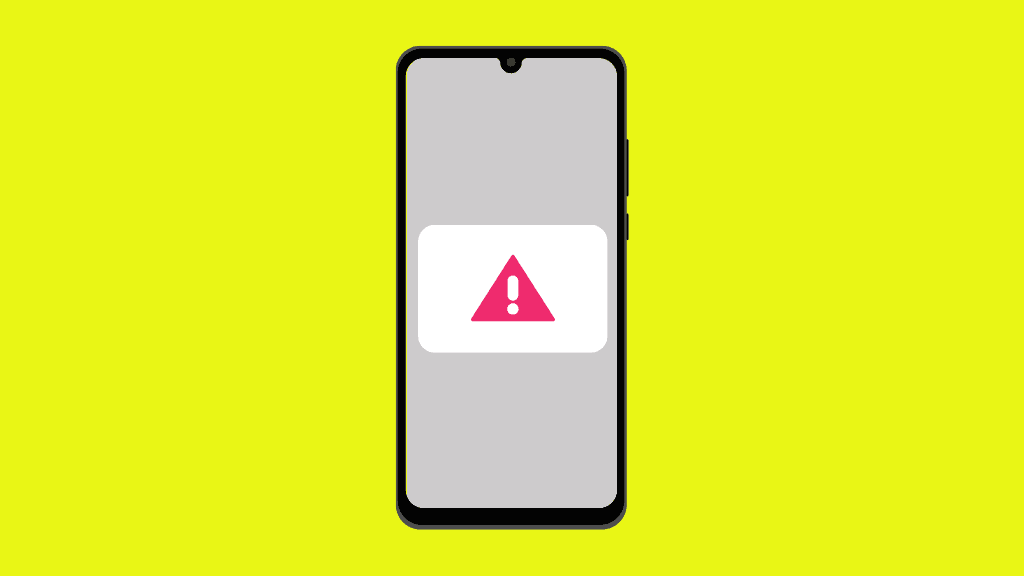
In that regard, Application Not Responding (ANR) errors are a common issue that Android app developers face. ANRs occur when an app is unresponsive for more than five seconds, prompting the system to display a dialog letting users know that the app has stopped responding.
If you’re struggling with ANRs and app responsiveness, a great first place to start is by following best practices for removing as much work from the main thread as possible. If you’ve already done this, however, and are still encountering ANRs then you’ll need to go a step further.
If you have a known ANR that you can reproduce in-house, but you don’t know the root cause or how to fix it, profiling your app to deduce what is happening on the main thread can give you the value information you need to fix it.
You can profile an Android app by recording a system trace that captures what’s running on the application process and its threads as the app runs. System traces provide insights into the performance of your app, including, among other things, CPU, thread, and memory usage. With this information, you can optimize your app to provide a better user experience.
In this post, we’ll discuss the steps you can take to use profiling in order to find and fix a known ANR on a local device.
Step 1: Enable profiling on your Android app
To find and fix known ANRs with profiling, the first step you’ll want to take is to make your app profileable. Doing so is an easy and straightforward process that just requires you to add the profileable element to your app’s manifest.
As a note, it’s always advised to run these types of performance diagnostics on build configurations that come as close to being what your customers use as possible. Specifically, using builds that are debuggable, or that have not been run through a code optimizing tool like R8 or Proguard, will lead to inaccurate traces (as they tend to be slower and do additional work that can impact performance). As of Android 10, builds are profileable without needing to be debuggable, so it’s recommended you do this on a device running at least that version of the OS.
Below is the two-step process for making your app profileable:
- To make our app profileable, add the ‘android:profileable’ element to the ‘<application>’ section in your app’s manifest file.
- Here’s an example of what the ‘<application>’ element in your manifest file should look like:
<application
    android_name=".MyApplication"
    android_allowBackup="true"
    android_icon="@mipmap/ic_launcher"
    android_label="@string/app_name"
    android_supportsRtl="true"
    android_theme="@style/AppTheme">
    <profileable android_shell="true" android_enabled="true"/>
    ...
</application>
Step 2: Choose a tool to profile your app with
Once your app is profileable, it’s now time to choose the profiling tool you’ll use to capture a system trace, so you can find and eliminate any known ANRs.
These tools help you capture run time information about the performance of an Android app so you can analyze what is going on under the hood. For example, a developer can use a profiling tool to monitor various aspects of their app while it runs — from CPU and memory usage, to network activity — and use that information to identify potential issues like ANRs. They can also record system traces that take an even more detailed recording of what is going on in the app when the process is running, so that they can be analyzed later.
Three commonly used app profiling tools for Android include the Android Profiler, Perfetto, and the System Tracing app that is shipped with Android:
- The Android Profiler: A profiling tool built directly into Android Studio, making it a go-to for developers of all levels. The Android Profiler lets developers view real-time data on CPU, memory, and network usage. It also provides a decent level of detail on information like thread activity and method calls. The Android Profiler is commonly used in development to get a high-level view of what is going on in the app as it lives right inside Android Studio. Sometimes, the most convenient tool is the best.
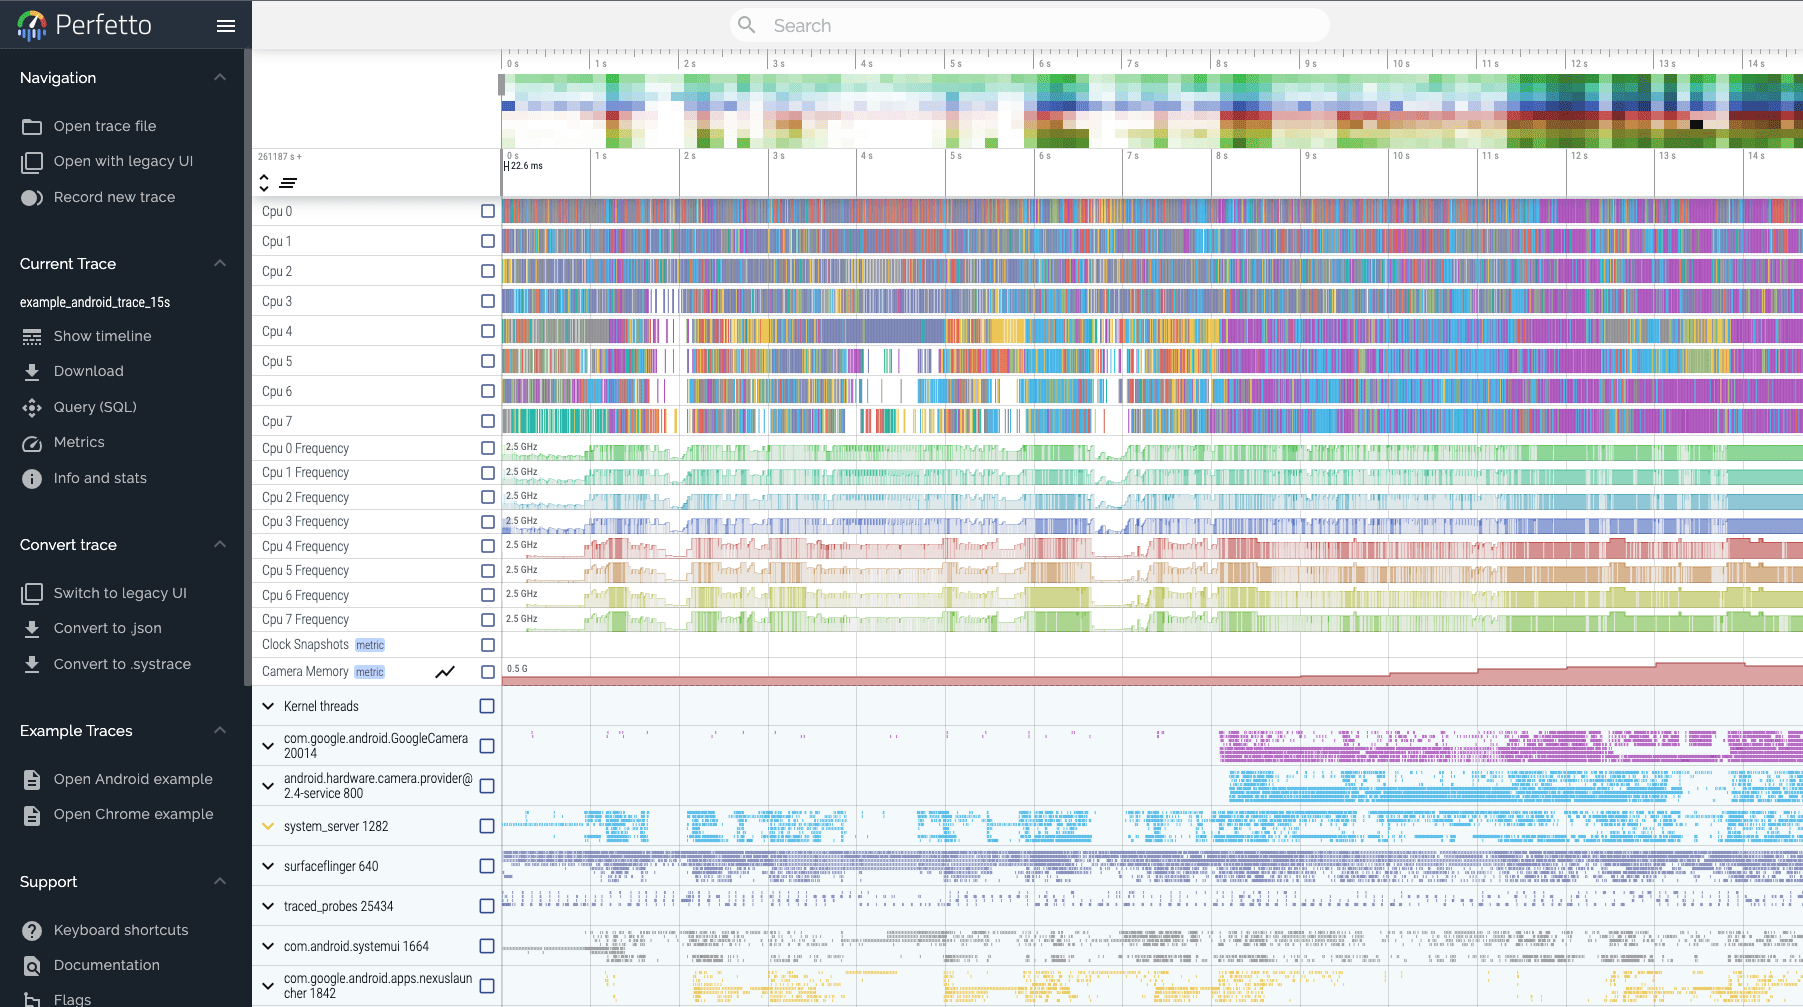
- Perfetto: A tool with a web-based as well as command line UI used to record and visualize Android system traces. Perfetto has much of the same functionality as the Android Profiler (and uses some of the same libraries under the hood) but offers a much better UI with which to view traces, in addition to greater configuration options. You can also view previously recorded system traces that have been saved as a file with the web UI. Given its much more powerful UI, Perfetto is often preferred when analyzing complex traces.
- System Tracing: An app that ships with most Android installations, allowing you to capture system traces right on the device. This app will generate a trace file that can then be viewed using Perfetto. System Tracing is incredibly useful, as it lets you capture system traces without using a computer.
Whether you choose to use the Android Profiler, Perfetto, the System Tracing app, or a different profiling tool all together, the right choice ultimately depends on your individual needs and, frankly, your personal preferences. As long as you can precisely identify what is running on your app’s main thread before or during an ANR, it is a good tool for you.
Step 3: Identify and eliminate known ANRs by profiling your Android app
The final step is leveraging the profiling tool of your choice, to analyze a profileable app, in order to find and eliminate a known ANR.
For example, imagine a product owner — or worse, an executive — approaches you with an ANR on their personal device. This isn’t the kind of error that’s known because of substantial user reporting, or that was flagged by your typical monitoring software. And while those data points are missing, you do have an advantage here: You have the device, in hand, that is experiencing the issue, and you already know how to reproduce it.
This is where a tool like the System Tracing app can be indispensable.
The first step to using a profiling tool to capture a system trace to solve ANRs is to determine the workflow that generates the error. For example, does the ANR occur when the user is scrolling too rapidly, when they try to play an embedded video, or when they add a specific item to their shopping cart?
Once the workflow is identified, use the profiling tool to record a trace of the work being done on the main thread of the app before and during the ANR.
From here, you can analyze the trace to see what is happening on the main thread of your Android app when the ANR workflow is executed. This will look like a timeline of events and components being initialized, as well as clues of bottlenecks and slowdowns in operations.
Sometimes this is enough information for you to identify the blocks of code that might be the root cause of the ANR. However, sometimes a long running block involving many method calls will show bottlenecks or a slowdown in operations. If this is the case, it can be difficult to determine the exact cause from your initial trace, and you’ll need to look deeper into what is happening in that long running block.
Doing this requires adding custom events that will appear in the system trace when the app is running so — when you record a trace the next time around — it will provide more detailed information that helps further break down what is happening in the previously opaque block. This can be done using the Jetpack Tracing library that Google offers.
For example, if we see that a particular method call is taking an unusually long time to execute, we may want to investigate the implementation of that method, see if there are things to optimize, and determine whether it really needs to be executed on the main thread. By analyzing the timeline represented by a system trace, we can identify the specific code that is causing the ANR and take steps to eliminate it.
Go further and capture ANRs in production with Embrace
App profiling tools like the Android Profiler, Perfetto, and the System Tracing app are great, free resources that can come in handy when you have a known ANR which can be reproduced on a local device.
This can save you a headache in the case of an executive experiencing responsiveness issues, or if you run into ANRs that you can easily reproduce in-house. However, profiling isn’t a great solution for when ANRs are wreaking havoc in production, at scale, and can’t be easily reproduced.
Unfortunately, no amount of profiling can tell you the scale of an ANR issue in production and how often users run into them.
Rather than forcing you to react to negative user feedback and reviews when ANRs turn up, Embrace is a platform that helps mobile developers capture ANRs in production for quicker identification and issue resolution.
Embrace empowers mobile developers with unmatched ANR reporting capabilities that provide insights into app behavior before ANRs occur.
By offering a detailed and accurate overview of every ANR event through sampled stack traces and flame graphs, Embrace streamlines the issue resolution process. Instead of wasting time attempting to recreate ANRs on a local device, you can capture them in real-time and easily reproduce them in your data.
Transform your ANR troubleshooting with Embrace’s comprehensive approach and improve your user experience by eliminating these issues. Sign up for free today and see the difference for yourself.