performance monitoring
Modern applications are powered by complex systems of interconnected processes. To keep these systems running smoothly, engineering teams rely on tracing — a way of capturing the full journey of requests as they flow through different services and components.
Ever since we introduced our Tracing product, Embrace has provided engineers with a unique, highly-granular solution for tracking all of the frontend tasks happening in their applications. This is done via interconnected spans, which are instrumented in the app’s source code, along with metadata, like attributes and events.
When seamlessly combined with backend solutions via our Network Span Forwarding feature, engineers can view a detailed breakdown of every task and operation executed during a user’s activity across the entire stack.
Frontend tracing together gives teams a granular view of how their application behaves at the point of intersection with the end user, helping engineers pinpoint bottlenecks, understand dependencies, and see where latency is introduced.
This level of visibility is critical for today’s apps, where user expectations are higher than ever and small performance hiccups can have big impacts on engagement and conversions.
When considering spans, there’s a few possibilities as to what the end result of a span can be. It can execute successfully and quickly, it can fail due to technical error, it can fail due to user abandonment, or it can execute successfully but slowly.
That last point is the one we’ll focus on here.
What exactly does “slow” mean in the context of spans and traces?
Well, until now, teams often had to rely on generic percentile-based measures, like P50s or P95s, to see which spans were “slow.”
While these standards are helpful, they fall short of giving engineers the full level of control and customization they need to define and understand latency as it relates to the diverse activities that take place across an app’s lifecycle. After all, 2 seconds might be acceptable to fire up an app from a cold start, but is intolerable when waiting for a search bar to auto-fill a familiar term.
That’s where our new release comes in.
We’re excited to introduce our latest feature to Embrace’s Tracing product, Slow Root Spans. This feature helps you identify performance bottlenecks and better prioritize your optimization efforts by providing a mechanism to define custom latency thresholds. Read on for more feature details.
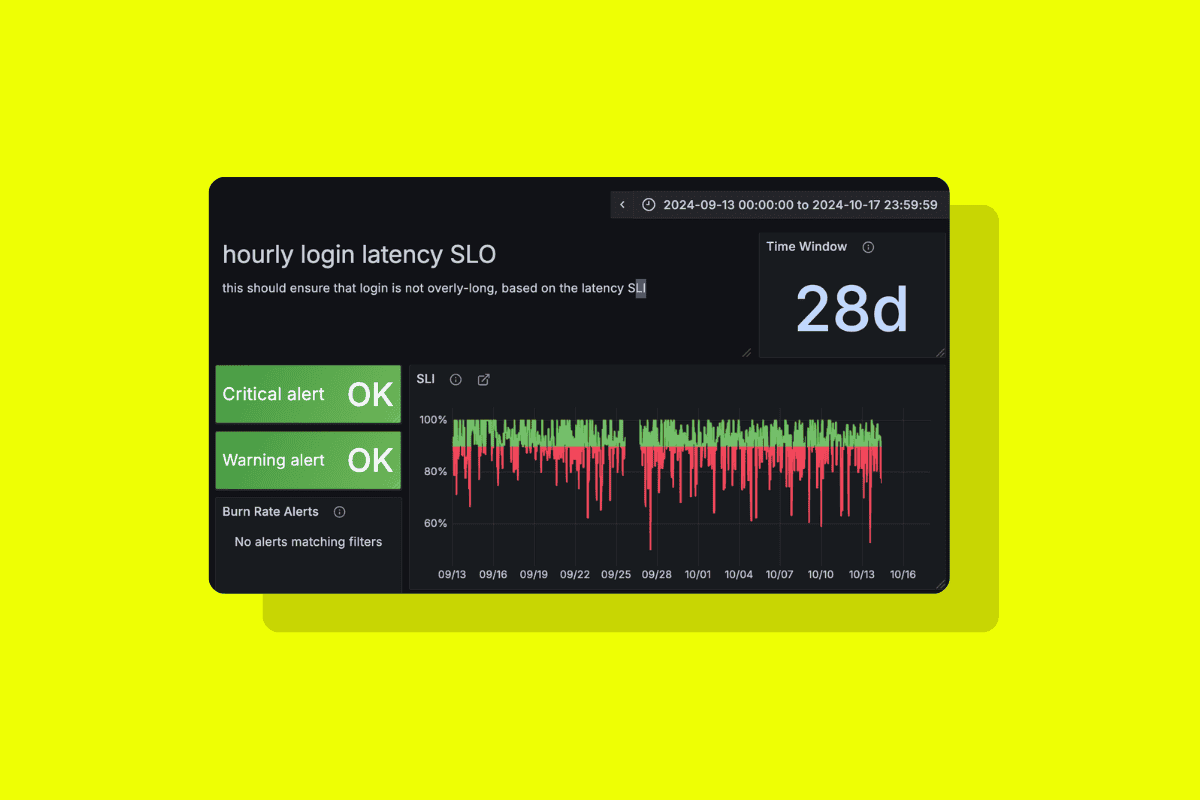
Traditional performance monitoring often relies on percentile-based metrics like “p95 latency.” While useful, these measures don’t always reflect your users’ actual needs or your team’s business objectives.
Slow Root Spans in Embrace gives engineering teams control over how slowness is defined and tracked. Instead of accepting one-size-fits-all latency metrics, you can now configure custom thresholds that align with your service level objectives (SLOs) and business priorities.
With Slow Root Spans, you can:

So what does this look like in practice when using Embrace?
Set custom thresholds: Once you have spans instrumented and Embrace is ingesting the data and showing it to you in your Tracing dashboard, you’ll be able to then set custom thresholds for these spans. You can configure millisecond-based thresholds for any span in the Root Span Summary page that reflect your own SLOs. You’ll also be able to historically track spans based on this threshold for performance trend analysis.

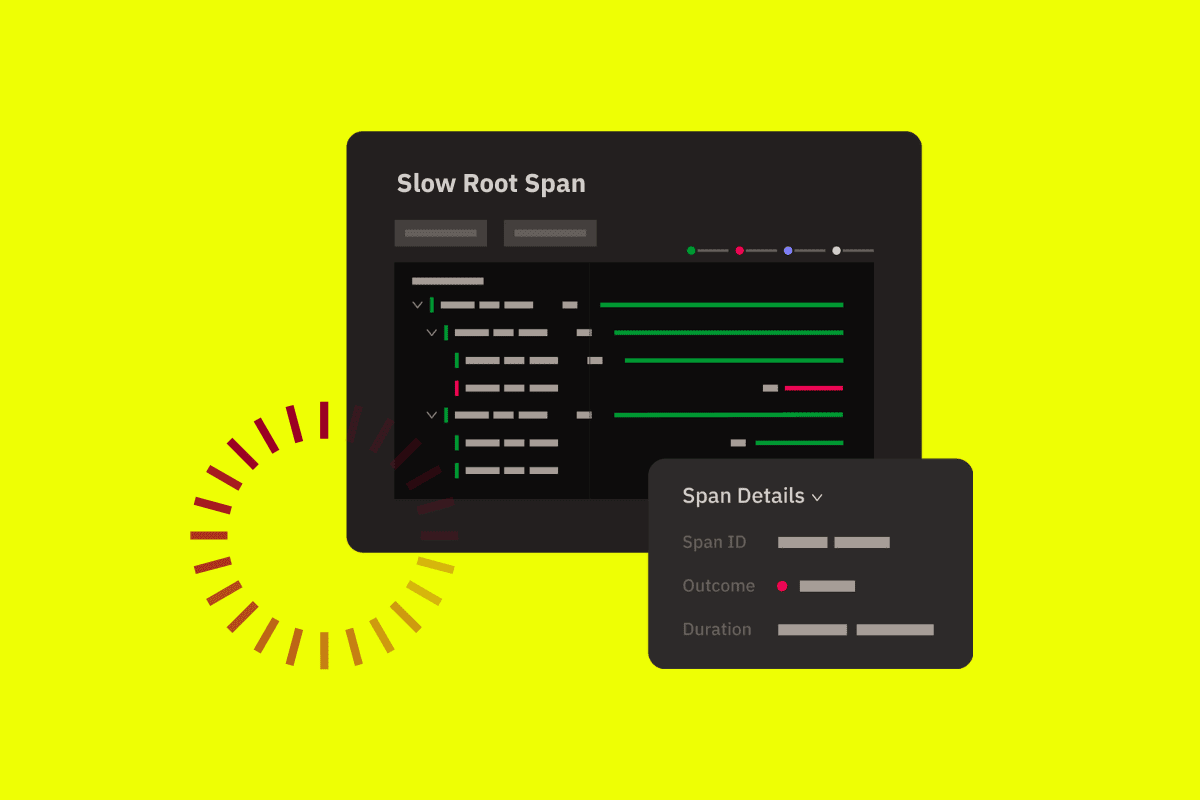
Analyze with context-rich visibility: You’ll be able to see Slow Root Spans everywhere you see normal spans. That means that you can see exactly where latency is impacting your end user experience by analyzing a span that has crossed your “slowness” threshold within the User Timeline, for example.
Get actionable insights: Since Slow Spans will appear across various feature pages in Embrace, you’ll be able to get quick insights into how latency is affecting key user activities. For example, root spans with at least one instance exceeding the slowness threshold will now pop up on the Issues page, so you can understand latency problems in relation to other types of errors. You’ll also be able to compare slowness across different app releases via the Release Health feature to get insight into potential regression issues.
")
We’ve integrated Slow Root Spans across the platform so you can spot and analyze issues wherever you work:
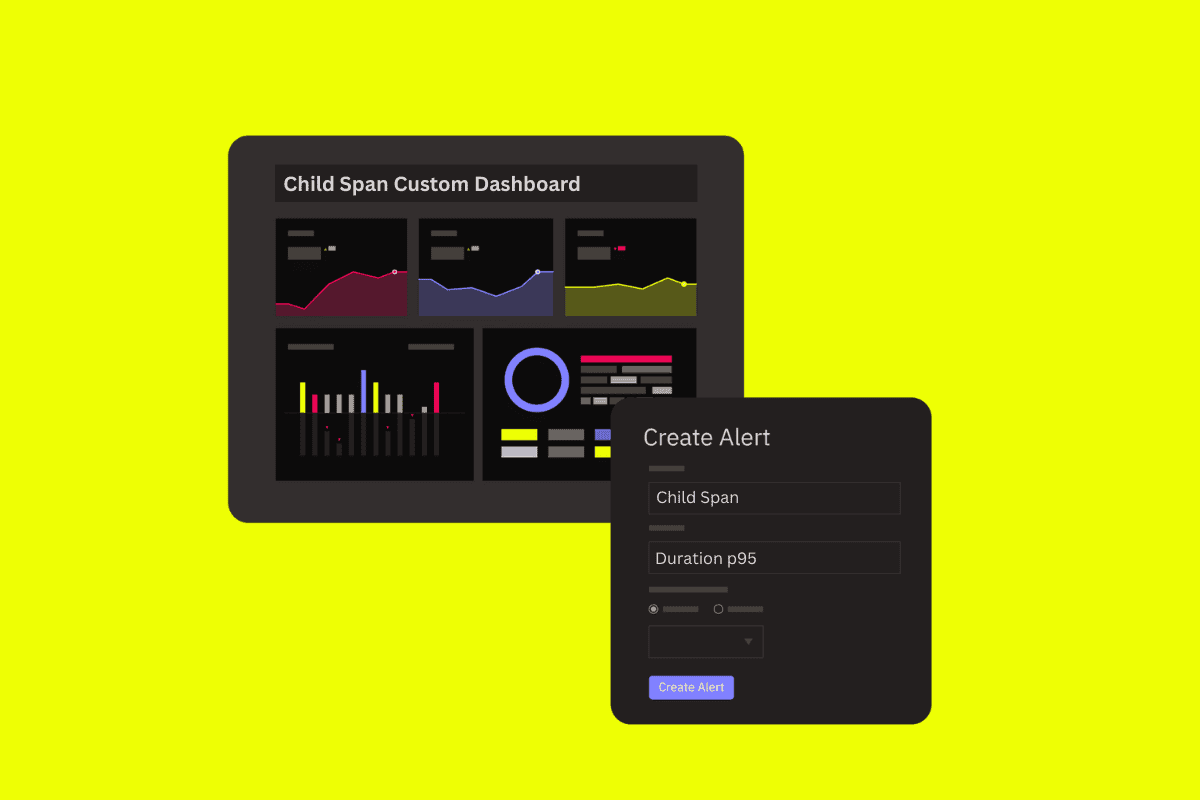
Integration with existing dashboard widgets: can monitor slow spans alongside other KPIs
With Slow Root Spans, Embrace is giving you the flexibility to track and manage performance in the way that best aligns with your users and your business. Instead of letting broad averages dictate your priorities, you can now focus on the slowdowns that matter most and resolve them before they affect your end users.
Check out our docs to learn more about Slow Root Spans. If you’re ready to try this new feature for yourself, log in or get started for free with Embrace today and start setting your custom thresholds.
Get started today with 1 million free user sessions.
Get started free