NEW REPORT! Overcoming key challenges in mobile observability: A guide for modern DevOps and SRE teams

Download now
Open Source

iOS OpenTelemetry exporter walkthrough

Learn how to use Embrace's OpenTelemetry SDK distribution to instrument traces in your app and export them to an observability backend.

Welcome to our traces and spans tutorial for iOS! If you’ve landed here, you probably know that Embrace recently released our OpenTelemetry SDKs, which is open sourced on GitHub. These let you leverage Embrace’s technology to capture data indicative of any performance issues affecting your app.

Now that our SDKs are open-sourced and OpenTelemetry-compliant, they have the major benefits of:

(1) being fully extensible, so you can build on our instrumentation to customize the mobile data you want to capture, collect telemetry from 3rd-party libraries, and add capabilities specific to your application’s needs.

(2) being interoperable with a lot of other open source tools, which means you can easily forward your data to where you want to view and analyze it.
With our open-sourced SDKs, you can collect and forward your mobile telemetry data to another service without being a paid Embrace user. 

In this tutorial, we’ll show you how to export a powerful OpenTelemetry data type – traces (and spans).

We’ll guide you through the steps to instrument and collect OpenTelemetry spans from your app via Embrace’s iOS SDK, and then how to send the traces that result from your interconnected spans on to a generic exporter. 

You can also learn more from our video tutorials on OTel signal instrumentation here

This walkthrough is available as a video below:

Step 1: Import the Embrace Apple SDK

As a pre-requisite for this tutorial, you’ll need to download and integrate the Embrace SDK to your Apple application. If you’ve already done so before, feel free to skip ahead to the next step.

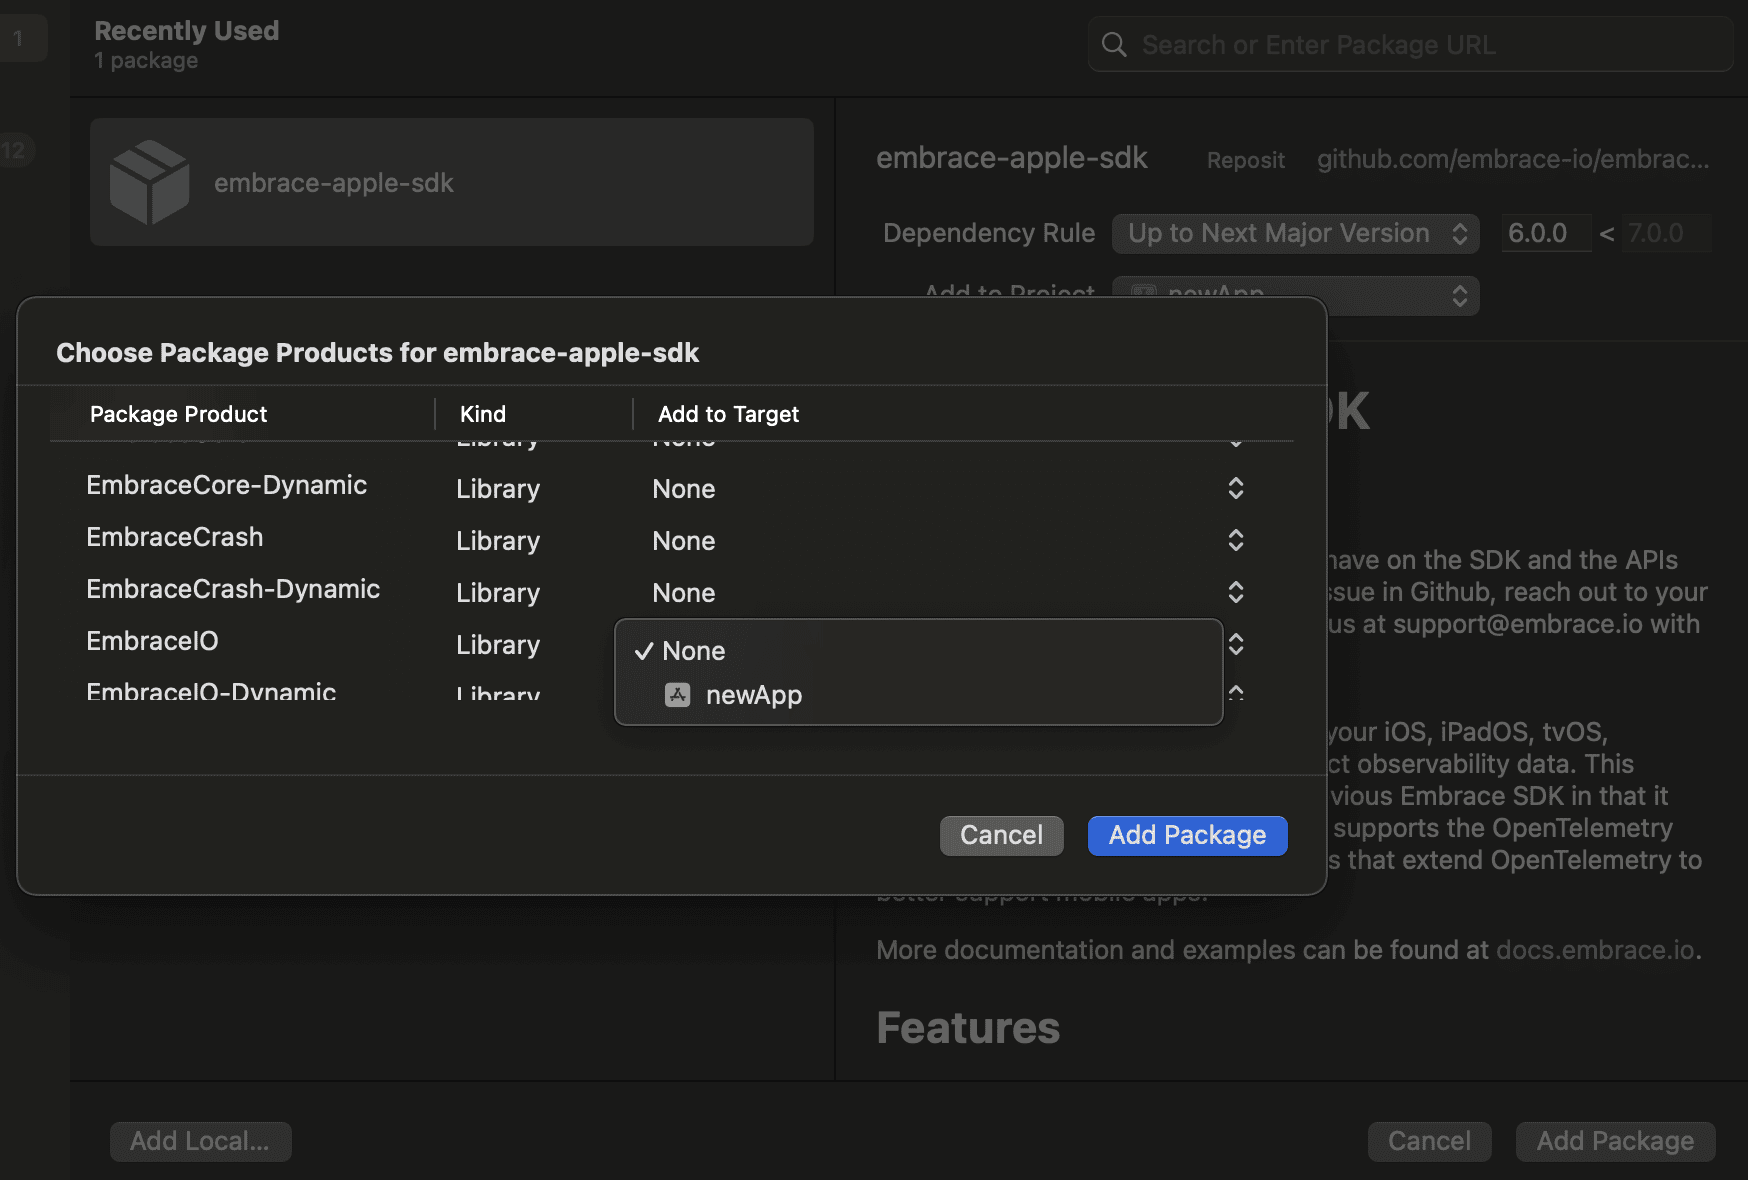
If you haven’t, the preferred and easiest way to grab the SDK is through Swift Package Manager. From Xcode, you can link to Embrace’s Apple SDK from the repo here. The EmbraceIO package will give the cleanest interface to our tracing features.

Step 2: Configure the Embrace client

Note: previous major versions of Embrace used a specific .plist file for configuration. The new SDK no longer uses a .plist, so even if you have Embrace in your app currently, you should read this section.

To get Embrace’s instrumentation in your Apple app, you will want to configure the Embrace client as close to the start of your app as possible.

First, import the EmbraceIO module in your app’s launch code.

Then you’ll add a .setup call for the Embrace SDK, which creates and specifies the capabilities of the shared client instance, and then .start that instance:

// App init
init() {
    do {
        try Embrace
            .setup(
                options: Embrace.Options(
                    appId: "-----",
                    platform: .default,
                    export: // read ahead for more about this
                )
            )
            .start()
    } catch let e {
        print("Error starting Embrace \(e.localizedDescription)")
    }
}

    The Embrace.Options object allows you to customize many capabilities in the SDK. For more detailed instructions on integrating Embrace, refer to this getting started guide.

    Note that a 5-character appId is required to start the SDK, so here we are passing a dummy appId to use the SDK without connecting an Embrace app.

    Step 3: Attach an OpenTelemetry exporter

    Before we begin instrumenting our app, let’s set up the OTel exporter so we have a destination to send our logs to once that data is actually generated. 

    The exporter is a component that will connect the Embrace SDK, which will collect the traces and spans, with an external OpenTelemetry collector that will receive the data.

    3A: Download the exporter

    While any exporter should be able to emit your Otel signals without any information loss, you won’t have to build the exporter yourself. A few open-source distributed tracing options exist even in Swift, which has itself not always been the focus for distributed tracing.

    For this example, we’ll be using the OpenTelemetry-Swift ZipkinTraceExporter. This will let the Embrace SDK send your traces and spans data to Zipkin, a tracing backend that supports all tracing signals and lets you visualize your span relationships cleanly.

    3B: The Zipkin exporter object 

    You can bring the ZipkinTraceExporter into your project using Swift Package Manager. You’ll then want to connect it to Embrace using the export argument in your Embrace SDK setup.

    The export argument expects an OpenTelemetryExport argument, which can connect span exporters, log exporters, both, or neither. By default, no exporters are added when the SDK is configured, so you will have to be explicit.

    To add the Zipkin exporter, you can configure the SDK as follows:

    // in init
    try Embrace
        .setup(
            options: Embrace.Options(
                appId: "-----",
                platform: .default
                export: OpenTelemetryExport(
                    spanExporter: ZipkinTraceExporter(
                        options: ZipkinTraceExporterOptions()
                    )
                )
            )
        )

    The ZipkinTraceExporterOptions uses default options that the Zipkin tracer expects to encounter, including the port on localhost to send trace data to (port 9411). You shouldn’t need to touch these options!

    Step 4: Instrument your trace

    Now that we’ve got the exporter and its destination set up, it’s time to go back to our source code and instrument some spans. 

    If you’re not familiar with spans and traces, they are duration-based and let you monitor a custom flow or transaction (trace) by breaking it up into its component operations (spans). You’ll know you should use traces and spans if you want to observe a process over time by collecting the steps that complete that process.

    For example, a trace might be taking a dog for a walk, and the spans or “units of work” that make up that trace might be finding one’s shoes, picking up waste, and returning home.

    Let’s instrument our trace around the walk, as follows:

    let walkTrace = Embrace
                    .client?
                    .buildSpan(name: "Afternoon walk")
                    .startSpan()

    The .startSpan call begins the span at this timestamp. This trace will run for the duration of our walk workflow, and we will later see it in Zipkin with its subprocesses.

    Step 5: Add child spans

    Spans can have parent-child relationships, which can be helpful in building and understanding hierarchy. Let’s link a child span to the walk trace we’ve already started, making that original span a parent:

    let findLeashSpan = Embrace
                        .client?
                        .buildSpan(name: "Find Leash")
                        .setParent(walkTrace)
                        .startSpan()

    Child spans can also have child spans, creating a hierarchy from the root trace. This is because units of work can themselves usually be broken down into smaller units.

    Step 6: Add span events and attributes

    We can give our spans even more context by adding attributes and events. Attributes are represented by key-value pairs, while events record a point-in-time condition that might also have attributes.

    If your walk brought you to Golden Gate Park, your parent trace might have an attribute of “location” with the value “park.”

    walkTrace.setAttribute(
        key: "walk-location", 
        value: .string("park")
    )

    Your dog might also be overly-insistent while you look for the leash, and you’ll want to document this to report back to your trainer:

    findLeashSpan.addEvent(
        name: "Barked and misbehaved",
        attributes: [
            "decibel-level": .int(120)
        ] )


    Step 7: Spans must be ended

    When using the Embrace SDK, you must end any in-progress spans. The Embrace SDKs have no automatic instrumentation to end a span if device changes occur. Ending a span is relatively simple, and can be flexible to your needs if you are measuring your traces for success.

    // end span
    walkTrace.end()
    
    // end span with failure
    walkTrace.end(errorCode: .failure)

    Step 8: Run your app

    Run your sample app a few times to generate some data. 

    Step 9: View your traces in the observability backend

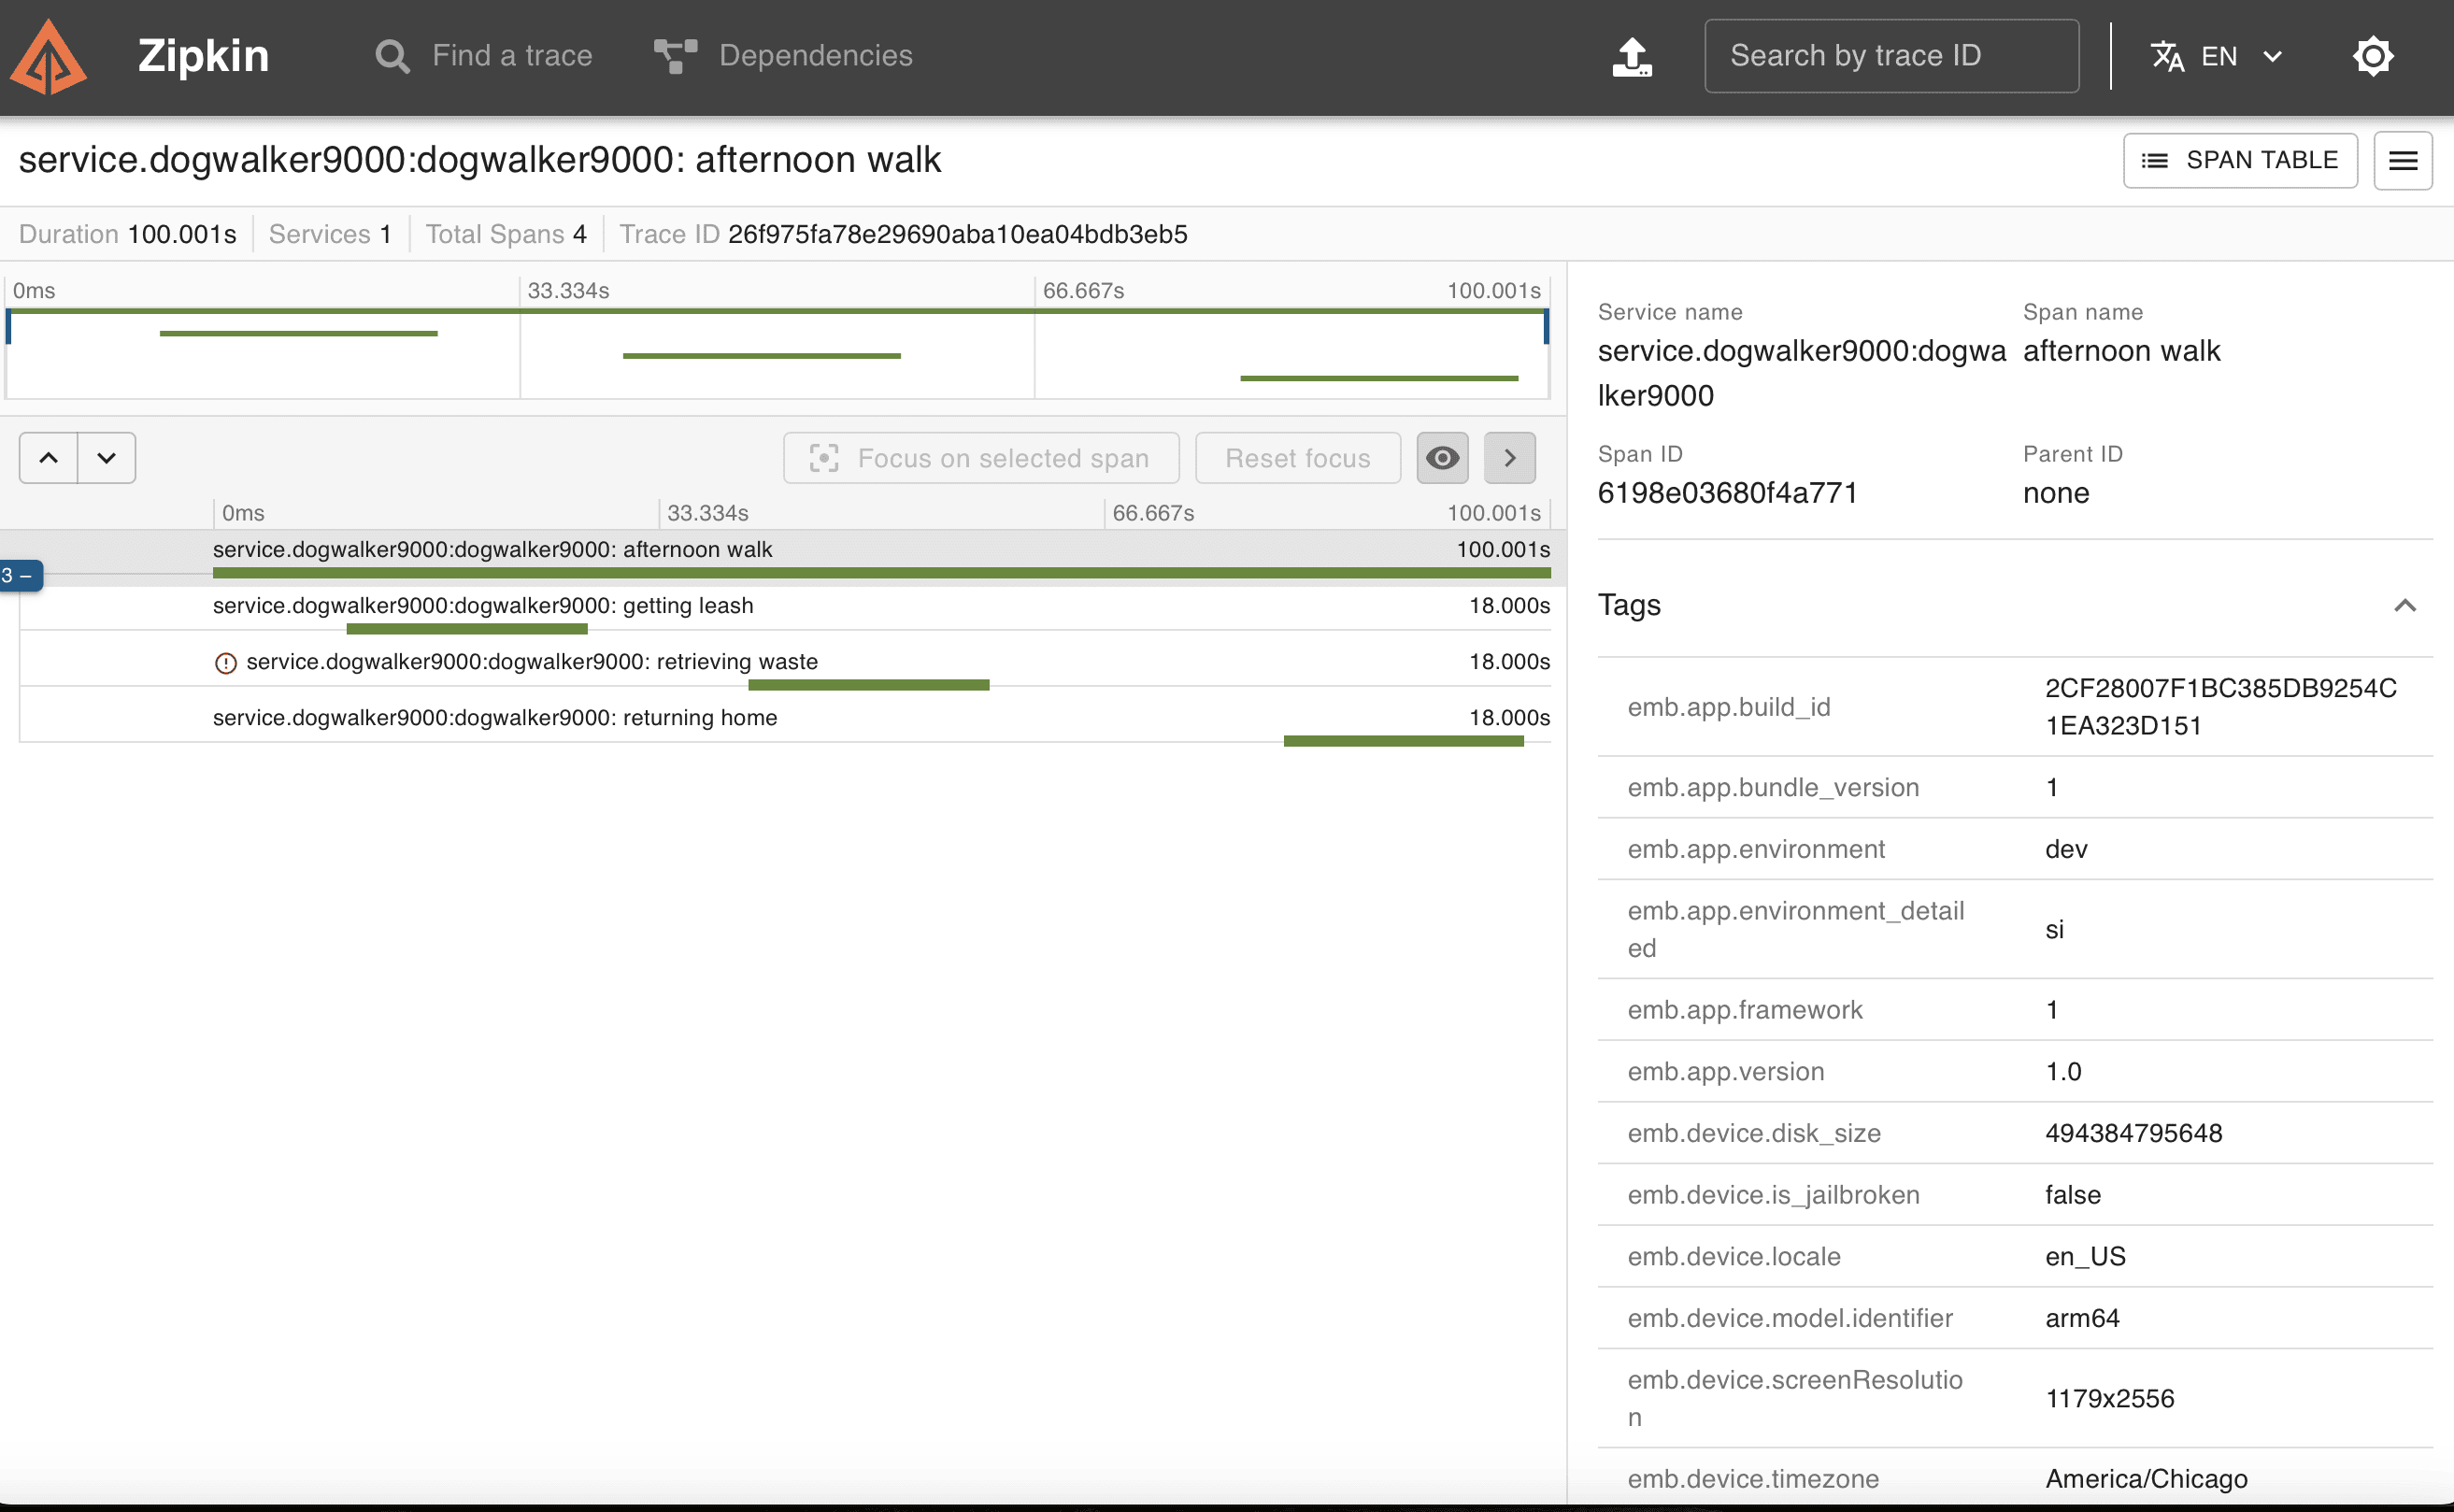
    In step 3, we set up an exporter to send our spans data to Zipkin. No further configuration is required to connect the SDK to the Zipkin instance. Now that we’ve run the app a few times, let’s check out the Zipkin UI and see if the data was indeed captured.

    Success! We’ve integrated the Embrace Apple SDK, set up an exporter to connect the application to Zipkin, instrumented our spans, and now are able to view them as traces in the tracing service. Full mobile-client instrumentation is available in our open-source SDK, even if you don’t want to use Embrace as your backend.

    Embrace Deliver incredible mobile experiences with Embrace.

    Get started today with 1 million free user sessions.

    Get started free

    Build better mobile apps with Embrace

    Find out how Embrace helps engineers identify, prioritize, and resolve app issues with ease.