❤️ NEW EVENT Feb 11: "In love with OTel and observability." Join our panel for a lively chat on wins, tool struggles, and the future of observability.

Sign up here
grafana

Building a mobile SLO with Embrace and Grafana

Engineering teams use mobile SLOs to monitor user flows and ensure user-impacting issues are detected and resolved quickly. In this tutorial, we'll show you how to use Embrace, in combination with Grafana, to build and monitor mobile SLO for your app – from initial app instrumentation, all the way to connecting to backend dashboards and alerts.

SLOs are powerful tools for maintaining application health and stability, as well as prioritizing engineering resources for feature vs. reliability work. 

While SREs and DevOps professionals have long been familiar with SLOs, these are still an emerging concept in the world of mobile. Few resources exist to help engineers jumpstart their mobile SLO development process. And most observability tools that have distinct SLO features aren’t equipped to bring mobile data into the fold. 

That’s where Embrace and Grafana come in.

In this tutorial, we’ll show you how you can use Embrace and Grafana to build mobile SLOs around key user-centric flows in your app. If you’d like to follow along yourself, you can create a free account in both Embrace and Grafana, and integrate the Embrace SDK into your mobile app. 

Once you’ve done these steps (or if you’d just prefer to stick with the tutorial), keep reading.
Step 1: Figure out what you’d like to measure

This is probably the hardest part – and it’s the first thing you’ll need to tackle. 

Traditional SLOs tend to focus on purely technical components, such as the availability of a service or the latency of an API call. These are great for understanding the health of a backend system in terms of resources and infrastructure. 

However, the key indicator for a mobile app’s health is a broad one: the user. Availability, latency, and error rates only matter if they are indicators of what is happening for the app user.

Your mobile SLO, therefore, should give you insight into what your end users are actually experiencing rather than what your services are reporting. In reality, this “experience” will be the amalgamation of many different technical components, both on the client and server-side. 

To figure out what you’re going to measure, think about what’s important in your app and what your users are trying to achieve.  Will users panic and delete the app if the app launches slowly, or if they can’t log in in a timely manner? Is the user’s main goal to complete a checkout process, or to scroll through a feed? Will your app “just work” with poor network connectivity, or in an area of no connectivity at all? Or will users think everything is broken?

Visualizing the user’s journey through your app, and the pain points they might encounter, will allow you to figure out what mobile telemetry you need to measure that journey.

Step 2: Translate a conceptual user flow into collectable data via spans

Once you know what you want to measure, you’ll have to translate that into some that is actually…well.. measurable.

If you’re already familiar with mobile telemetry, this will be easier. If not, you might have to adjust your thinking a bit as mobile data is very different from backend observability data. It’s more variable and complex.  It’s also more prone to delays, order inconsistencies, and the unpredictable behavior of users. You can read about that in greater detail here

For the sake of this tutorial, let’s take the example of a user login flow. You may have identified, in step one above, that a critical functionality for your app is users’ ability to login successfully and in a timely fashion. 

The best way to translate a user flow, such as the login process, to something measurable is to wrap it in a span. We do this by calling the Embrace span API directly in our app’s source code. Spans are extremely useful as a data type in that they support relational hierarchies. So, within a large, root span that encompasses the entire frontend “login” flow, we can have child spans that capture the technical components that constitute the bigger, end-to-end operation. 

An added bonus of using spans with Embrace is that you have a means to connect frontend and backend operations. That’s because network calls are represented as child spans within larger root spans, and have their own unique ID. When a call gets to the server and is picked up by a backend observability tool (like Grafana), that same unique ID follows it, allowing you to trace the span through the entire stack and see a cohesive picture of both the mobile frontend and backend infrastructure involved in your app’s functionality. 

Here’s what it might look like in your source code to wrap a login flow in a span:

An iOS app code snippet showing an instrumented span around a user login flow.
A span instrumented around a login flow in the iOS app source code

Step 3: Check to see you’re receiving data in Embrace

Once you’ve instrumented a span around your desired user flow, you should start to see the data coming in to the Embrace platform. 

Let’s first check our tracing product view, which aggregates all of the user flows we’ve instrumented in our app. These are labeled as “Root Spans,” and we can see the login flow is being captured here, with over 8,000 instances of this flow recorded so far.

A screenshot of the Embrace dashboard showing an aggregation of al root spans for the attempted user login flow.
The aggregate of all root spans instrumented in this demo app, as shown in the Embrace dashboard
The view of all aggregated root spans for the previously instrumented user login flow, as shown in the Embrace dashboard

Since Embrace captures 100% of all user sessions, we can actually click into any individual instance of our login trace and find the session that it’s associated with. We can then have a look at all of the events and interactions across that section for better context into how our end user experienced their login flow. 

Screenshot of Embrace's Use Timeline showing the attempted login span within the context of full user's session and activities.
The view of Embrace's User Timeline, with attempted login span instances contextualized among other user activity

Step 4: Create a custom metric based on the root span

Embrace’s platform allows you to deep-dive into a particular flow and see it within the context of an entire user’s experience. 

In order to actually translate this mobile user flow into an SLO, however, we’re going to want to send our data to Grafana. To do that, we’ll first need to create a custom metric based on the root span that encapsulates our user flow. 

Let’s continue to work with our login flow example. Going into the “Custom Metrics” section of the Embrace Settings page, we’ll create a custom metric that uses the data from the attempted login root span. For this custom metric, we’ll focus on the time it takes for the user to complete an attempted login, as our ultimate SLO is going to be around latency. We’ll call this custom metric “Login_latency.”

Going back to the Embrace platform, you can see what this custom metric looks like in its own dashboard view: 

A screenshot of the Embrace dashboard showing a custom metric created using the span for attempted login.
A custom dashboard view in Embrace, showing the data trends of an attempted login custom metric

Step 5: Send the custom metric to Grafana

We’ve got our desired user flow (attempted login) instrumented, we’re collecting the data in Embrace, and we’ve created a custom metric to track its latency. The next step in building an SLO for this user flow is to send this data to Grafana, where we can then use an OOTB SLO product and look at this user flow alongside some of our backend SLOs. 

Since Embrace has a pre-built integration with Grafana, the process for adding Grafana as a Data Destination is pretty straightforward and outlined in our docs here.

A screenshot from the Embrace dashboard showing the list of Data Destinations, including Grafana, where you can forward your custom metric.
Custom metrics being forwarded to any Data Destination, as seen in the Embrace UI

Note that Embrace’s custom metrics offer different time aggregations for different use cases. These aggregations are 5-minute, 1-hour, and 1-day intervals. While 5-minute buckets might be helpful to immediately alert your team to any issues, delays in data can create an incomplete picture of the full activity in your app. SLOs should be made from metrics forwarding in larger time windows, like hourly or daily, to account for the data delay in mobile activity. You can read more about data delays in mobile and how to handle them here.  

Once we’ve completed the process of linking Embrace and Grafana, we should check to see that our custom metric is indeed coming through in our Grafana instance. To do so, we’ll go to the “Metrics” page under the “Explore” tab in our Grafana instance. Here, we can see that we have been receiving our latency login metric at 5-minute intervals for quite some time.  

A screenshot from Grafana showing the custom metric creating in Embrace, attempted login, flowing into the Grafana UI.
A view of the Embrace forwarded metric for attempted login, as seen in the Grafana dashboard view

Step 6: Build an SLO using this metric in Grafana’s SLO dashboard

Now that we’ve got our login latency metric data flowing into Grafana, we’ve come to the very last step – building an actual SLO using this data. 

Let’s go to Grafana’s SLO dashboard product. From the menu, we’ll go to Alerts & IRM -> SLO.

Screenshot of the Grafana dashboard highlighting the menu where you can navigate to SLOs.
Navigating to Grafana's SLO tool

From here, we’ll select “Manage SLOs” and then “Create SLO.” 

Screenshot from the Grafana dashboard showing where to select the "create an SLO" option.
Selecting "Create SLO" from Grafana's SLO page

This brings us to a more detailed SLO creation page in Grafana. We’ll have to make sure that the data source we’ve selected is the correct one to ensure we’re piping in the mobile metric from Embrace. 

In this screen, you’ll fill in a few parameters to create the SLO. First, ensure you’re using the data window that you’re interested in, as well as the correct data source. This will be the same data source you set up initially when forwarding your custom metric to Grafana via Embrace’s Data Destinations (step 5 above). 

Next, you’ll outline the metrics you actually want to compare, which will ultimately comprise your SLO. 

Screenshot of the Grafana dashboard showing all the fields and parameters for creating an SLO.
Inputting parameters into Grafana's SLO tool

You will have to outline the exact data you want to be queried. Using the “Ratio” option, you can create a ratio of specific outcomes as compared to the entire sample set of outcomes for your metric. You can also outline a more in-depth query comparison in the “Advanced” tab. Both approaches use PromQL to outline the query.

As an example, using the latency_login metric above, you may wish to look at login attempts that complete successfully in under 10 seconds as a ratio of all login attempts. For time series events like spans, Embrace groups durations into different buckets for the forwarded metrics. The “Success metric” would be: 

embrace_latency_login_hourly_total{root_span_duration_bucket!~"10000|15000"}

And the “Total metric” would be

Embrace_latency_login_hourly_total

Once you’ve got your query written and accepted, you’ll see the SLI data. 

The next step will be to set your targets and error budget, so that you can actually see when the SLI has breached your desired SLO value and, if desired, set up an alert. 

Screenshot of the Grafana dashboard showing the set up of an error budget for a newly created SLI.
Setting an error budget in Grafana's SLO tool

The last steps for creating your SLO are to give it a name, description, and (if desired) set up an alert. If you are using Grafana across your team to monitor backend services, you can actually add labels to this SLO to assign or flag it to them. 

Screenshot of the Grafana dashboard showing how to add a name and description to a newly created SLO.
Adding a name and description to your SLO in Grafana
Screenshot of the Grafana dashboard showing how to add an alert for a newly created SLO.
Setting alert rules for your SLO in Grafana

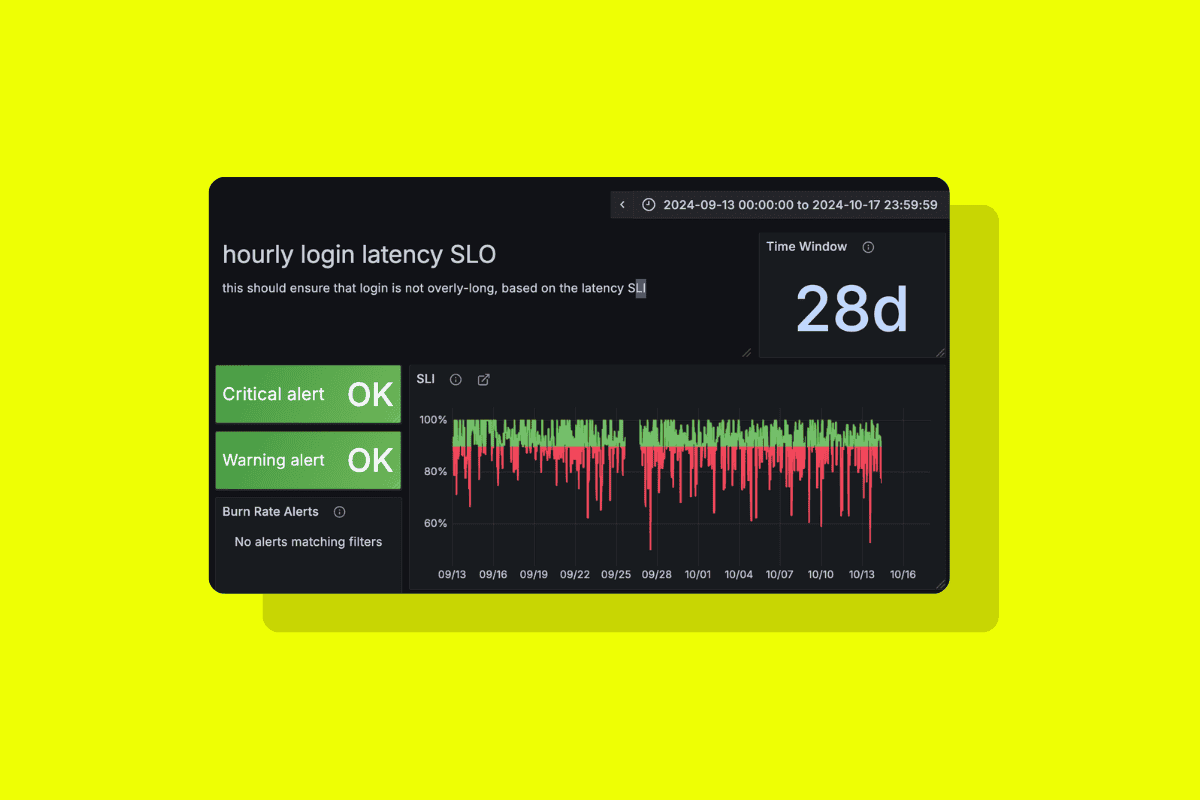
Once you finish the set-up and review your SLO, a dashboard will automatically populate with your SLO trends and key metrics in Grafana. It should look like this: 

Screenshot of a pre-populated SLO dashboard on Grafana showing trending data.
The default SLO dashboard view in Grafana, using Embrace data to populate a mobile SLO

And there you have it! Now you’ll be able to set up a mobile-specific SLO in Embrace and Grafana to monitor your critical user flows. 

For more insight into SLO best practices, check out our full guide on defining and measuring SLOs for mobile.

Embrace Deliver incredible mobile experiences with Embrace.

Get started today with 1 million free user sessions.

Get started free

Build better mobile apps with Embrace

Find out how Embrace helps engineers identify, prioritize, and resolve app issues with ease.