When it comes to mobile, engineers often have to deal with the issue of delays in receiving telemetry from their app in their observability platform. This can cause confusion when receiving alerts about issues.
Embrace’s new enhanced alerting visualizations are here to help mitigate this.
This feature upgrade is designed to provide a clearer, more comprehensive understanding of your mobile data and issues alerting. This enhancement addresses the challenges presented by delayed mobile data, which can impact the accuracy and transparency of alert triggers.
The challenge of delayed mobile data
Mobile data delivery can be inconsistent due to offline devices, intermittent connectivity, and other disruptions. Sometimes, events that a user experienced on the app are not noticed until hours, or even days, later by the server and observability tooling. This is because of delays in actually sending the data across the network, which can vary depending on when connectivity is restored or when a user re-opens their app.
When the Embrace system processes an alert, it evaluates the data received at that specific point in time. Alerts are triggered (or not) based on this data which may exclude some delayed data that has not yet arrived.
This can lead to discrepancies when data arrives later, as engineers checking the dashboard will see a more up-to-date view of their data that may be slightly different from what they saw when an alert went out. In some cases, an alert was not fired at a certain time, even if users experienced errors that should have prompted it, due to data not being received. Engineers would see the error later in the dashboard, potentially creating confusion as to why an alert wasn’t fired and what really happened. In other cases, an alert may fire if errors are above a certain threshold. When more “normal” data comes in later, however, the condition may have re-stabilized, leading to confusion when looking at a seemingly healthy dashboard.
Introducing Alert Data View and Latest Data View
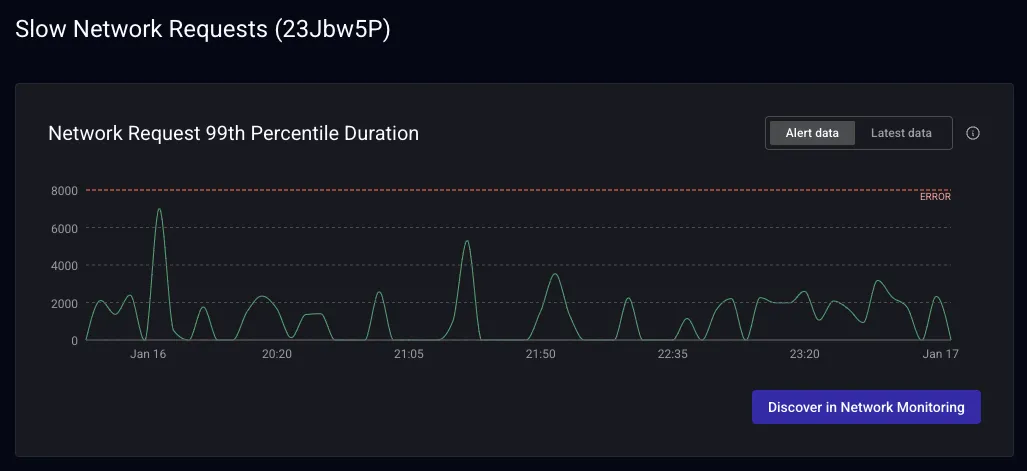
To address these discrepancies, our dashboard now visualizes two distinct datasets when you view your alerts:
- Alert Data View: This view displays the data as it existed at the moment the alert was triggered
- Latest Data View: This view combines the alert-time data with all data received afterward, providing a “real-time” data view consistent with the rest of the Embrace platform.
This update is a feature unique to Embrace, and reflects our deep expertise in mobile, which is a unique and complex environment.
Benefits of two data views
This new feature helps in situations where delayed data can cause confusion.
Alert Fired, Conditions Look Normal Later: If an alert was triggered, but the conditions appear normal after delayed data arrives, the Alert Data View allows you to see the data that initially triggered the alert.
Alert Not Fired, Issues Appear Later: If an alert was not triggered, but errors or issues appear later that should have prompted an alert, the Latest Data View helps you understand why an alert was never sent.
By providing both alert-time and real-time perspectives, engineers can account for the impact of delayed data. This leads to a more realistic understanding of app performance, better analysis, and increased transparency in alerting decisions.
This feature is now live for all customers. You can learn more on our docs site and explore it for yourself by navigating to your Alerts view.
If you’re not an Embrace customer, you can get started for free here.
Get started today with 1 million free user sessions.
Get started free