Introducing Embrace Web RUM: User-focused observability is now available across web and mobile!

Learn more

Monitor JavaScript exceptions with Embrace

When users visit your website or web app, they expect it to just work. But too often, poor performance, broken interactions, or even full-on crashes get in the way—and users don’t stick around to find out why.

Understanding how and why these critical performance issues happen is essential to maintaining performant and satisfying web apps for your end users. That’s where Embrace Web Real User Monitoring (RUM) comes in. 

Embrace brings powerful observability to the frontend, so you can understand the real-world user experience across devices, browsers, and networks. By connecting user behavior with deep technical telemetry, teams can proactively detect and fix the issues that matter most.
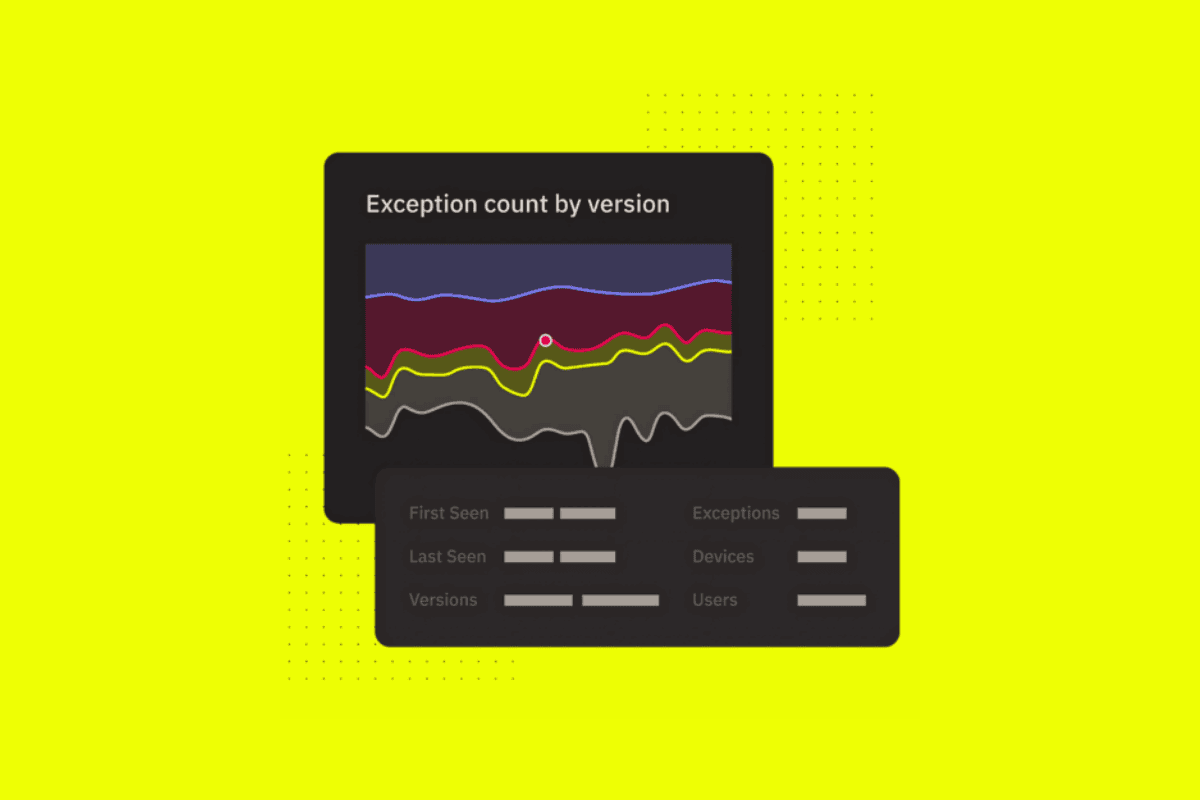
A key feature of Embrace Web RUM is JavaScript exception monitoring. 

JavaScript errors are a leading cause of user frustration and abandonment, especially on complex, dynamic web apps. Without a way to reliably capture and diagnose them in production, you’re essentially flying blind.

Understanding JavaScript exceptions

JavaScript exceptions are runtime errors that occur when the browser tries to execute broken or invalid code. These can result from bugs in your own application code, third-party scripts, or edge cases in user interactions or environments.

When an exception occurs, it can cause everything from small glitches (like a broken button or unresponsive element) to serious failures (like full-page crashes or infinite loading states). 

Worse still, many of these errors go undetected if you’re only looking at aggregate metrics or server-side logs.

JavaScript exceptions can’t be resolved with backend observability tools

JavaScript exceptions happen in the browser, on the client side, and typically don’t surface in backend monitoring tools at all. This makes having a dedicated frontend monitoring solution essential.

For example, let’s say a third-party analytics script throws a TypeError that stops a checkout button from working. Your backend will never know the user clicked it because the event was never triggered. From the server’s perspective, everything looks fine, even though users are getting increasingly frustrated that they can’t click a check-out button, and silently abandoning their carts as a result. You’re now taking a serious hit on conversion rates without being able to understand the real reason why. What’s worse, you may not even notice until you start looking at commercial site trends a few weeks later because there’s nothing alerting you to the error in real-time. 

As another example, consider a React component that fails to render because of a null value passed into a prop. The page may appear blank or glitchy to the user, but unless you’re monitoring frontend exceptions, that failure won’t be reflected in typical performance dashboards or error logs.

Even more insidiously, some errors might only affect certain combinations of browsers, screen sizes, or device types—making them impossible to catch with synthetic testing or server-side logging alone. Without real-user visibility, these bugs stay hidden until users complain or stop using your website.

Introducing JavaScript exception monitoring with Embrace

Embrace’s JavaScript exception monitoring gives you full visibility into the errors affecting your users. The Embrace SDK captures and reports unhandled exceptions automatically in the dashboard. It also gives you the option of manually reporting handled exceptions by calling the API, so you can glean insight into issues that are problematic, but not totally catastrophic, to your end user experience. 

With this feature, you can:

  • Capture all uncaught JavaScript exceptions across your web app automatically, including both synchronous and asynchronous errors.
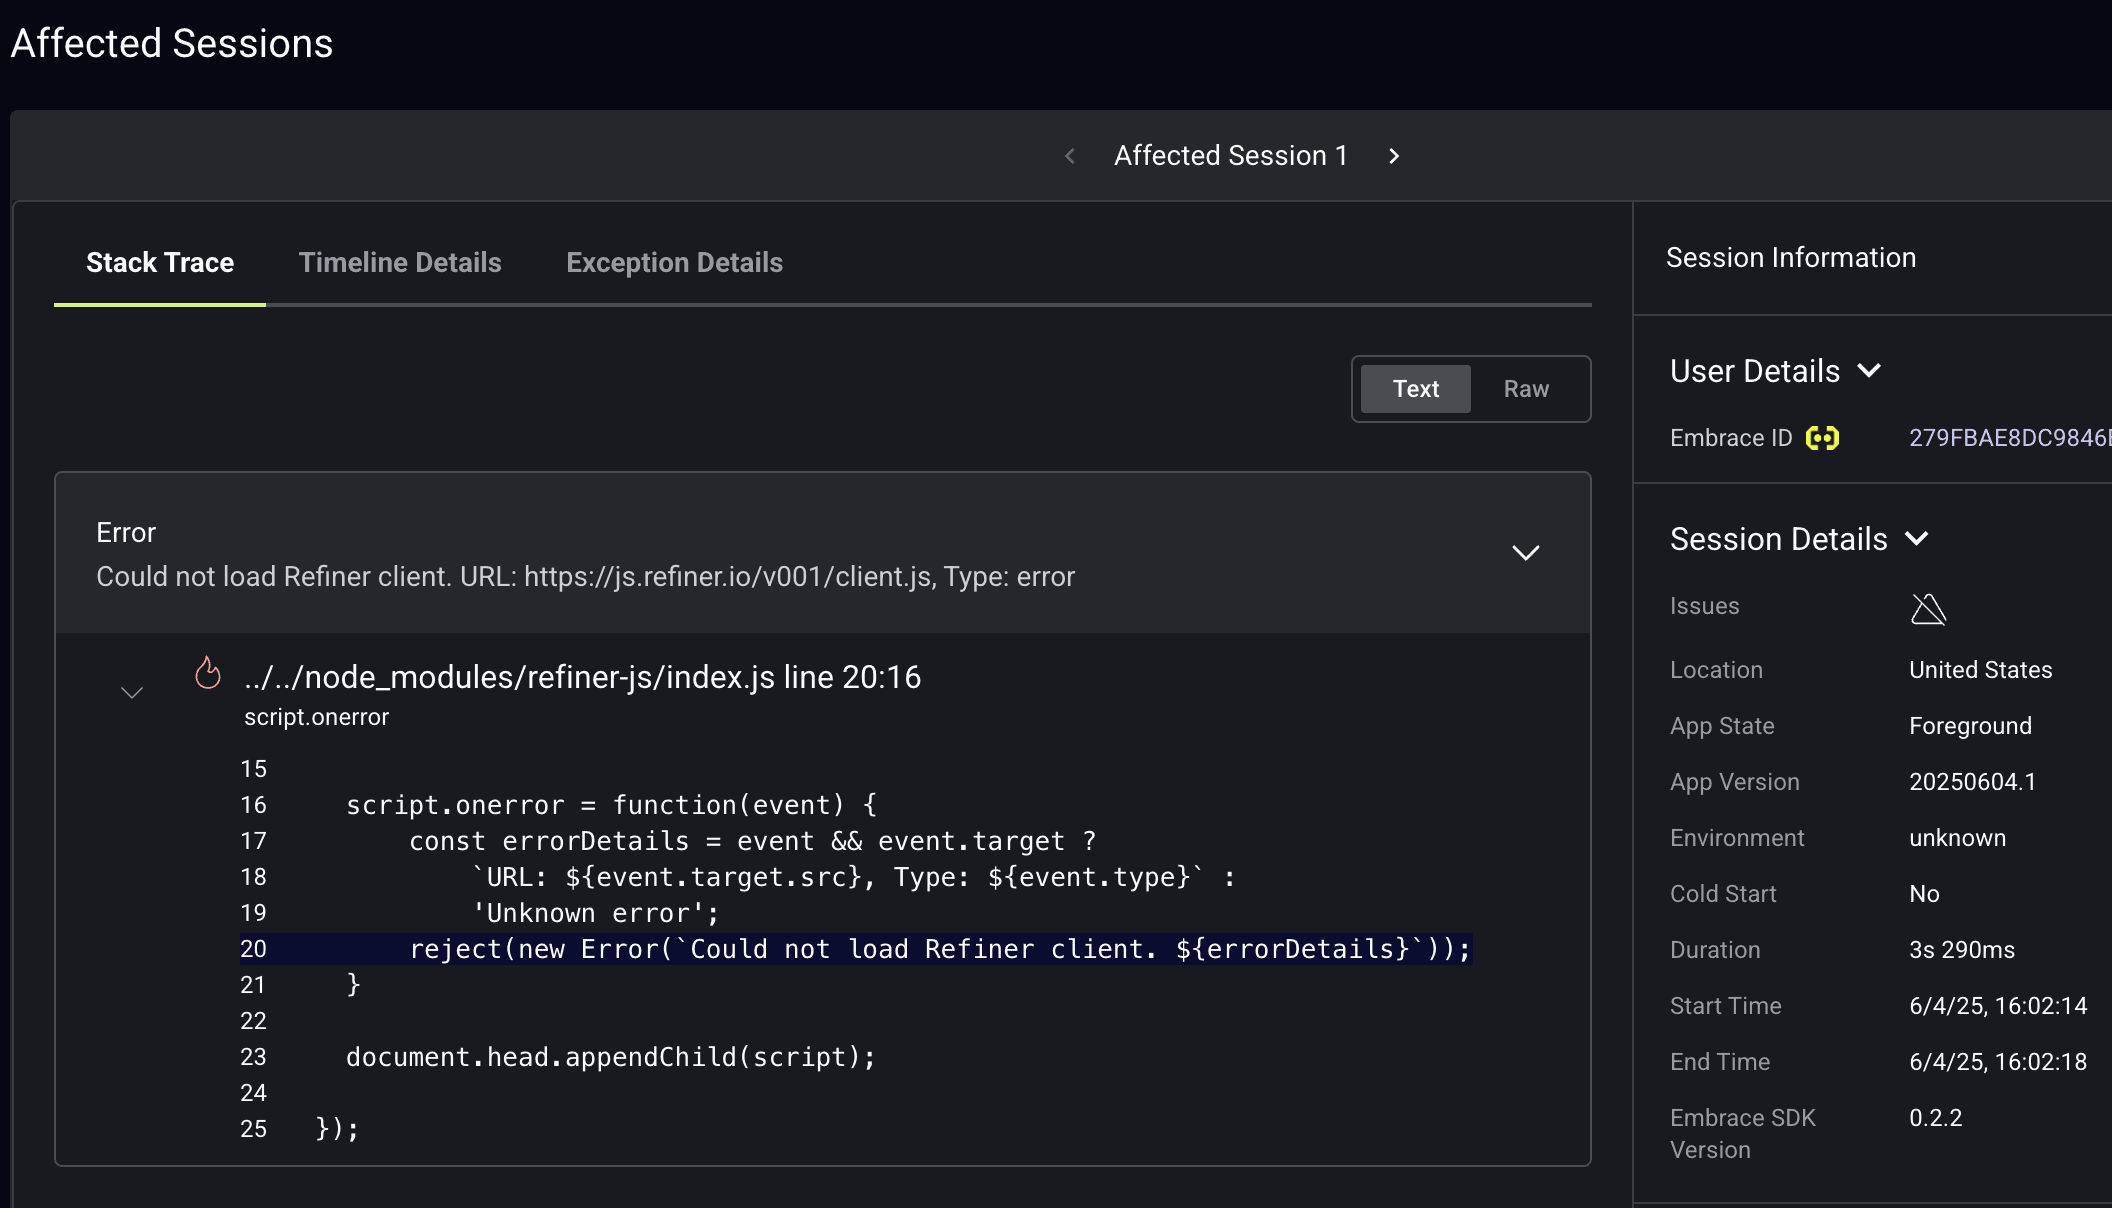
  • Reproduce issues quickly with full context: stack traces, source file references, affected URLs, and browser/device/environment details.
  • See how errors impact real users by connecting exceptions to user sessions, funnel stages, and other behavioral insights.
  • Prioritize effectively by filtering and grouping errors based on frequency, severity, and affected user segments.

What makes Embrace different is its user-centric approach. Instead of treating JavaScript exceptions as isolated log entries, Embrace ties them to the actual user experience—so you know whether that error caused a user to rage click, abandon a session, or never convert.

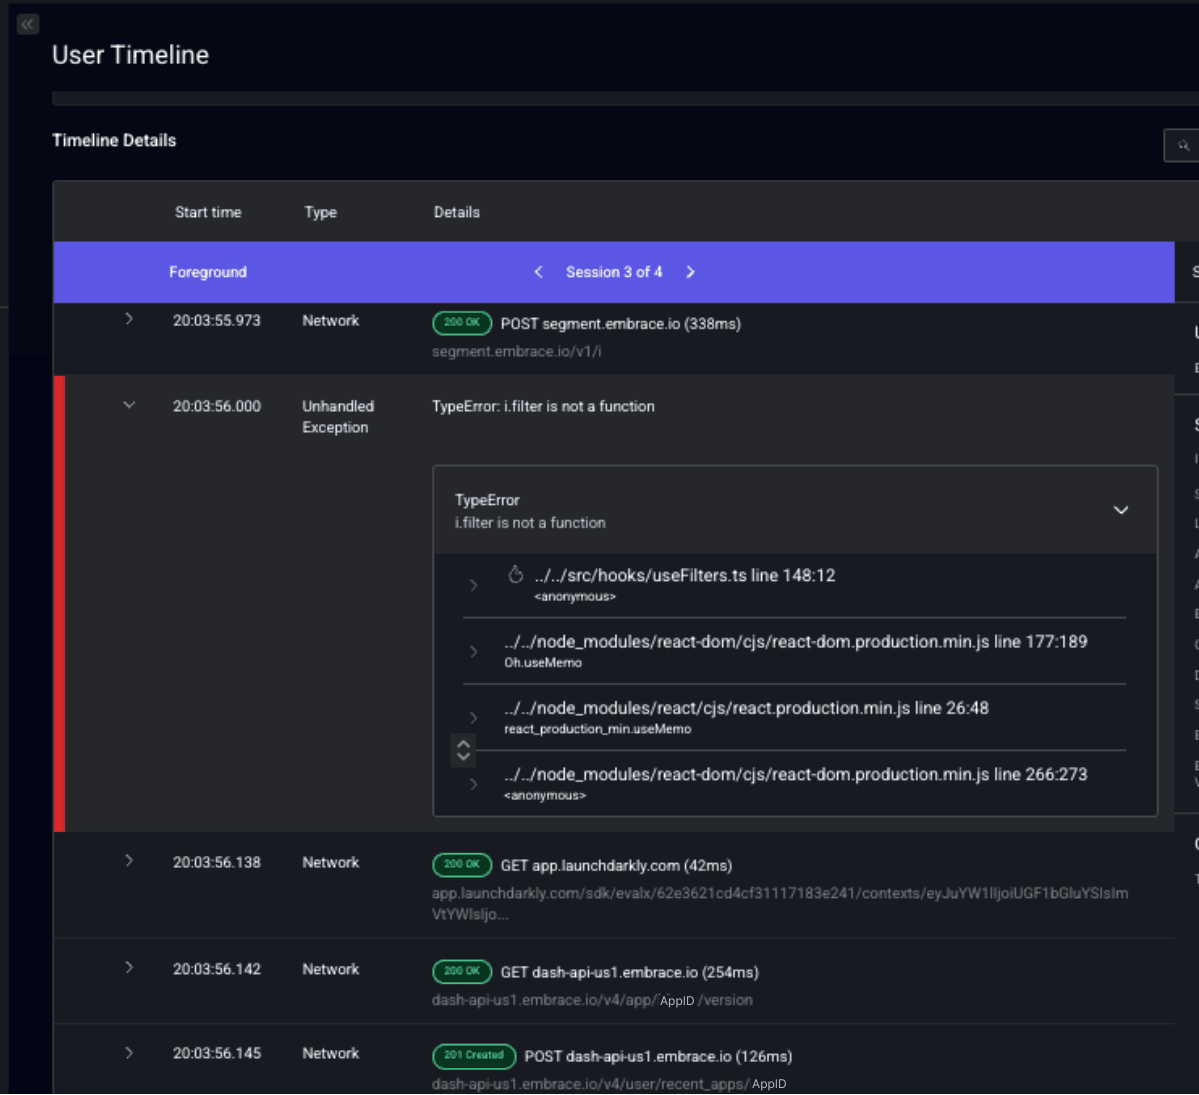
We do this by integrating exceptions directly into the User Timeline, giving you the complete trail of technical and behavioral events that lead up to the error. 

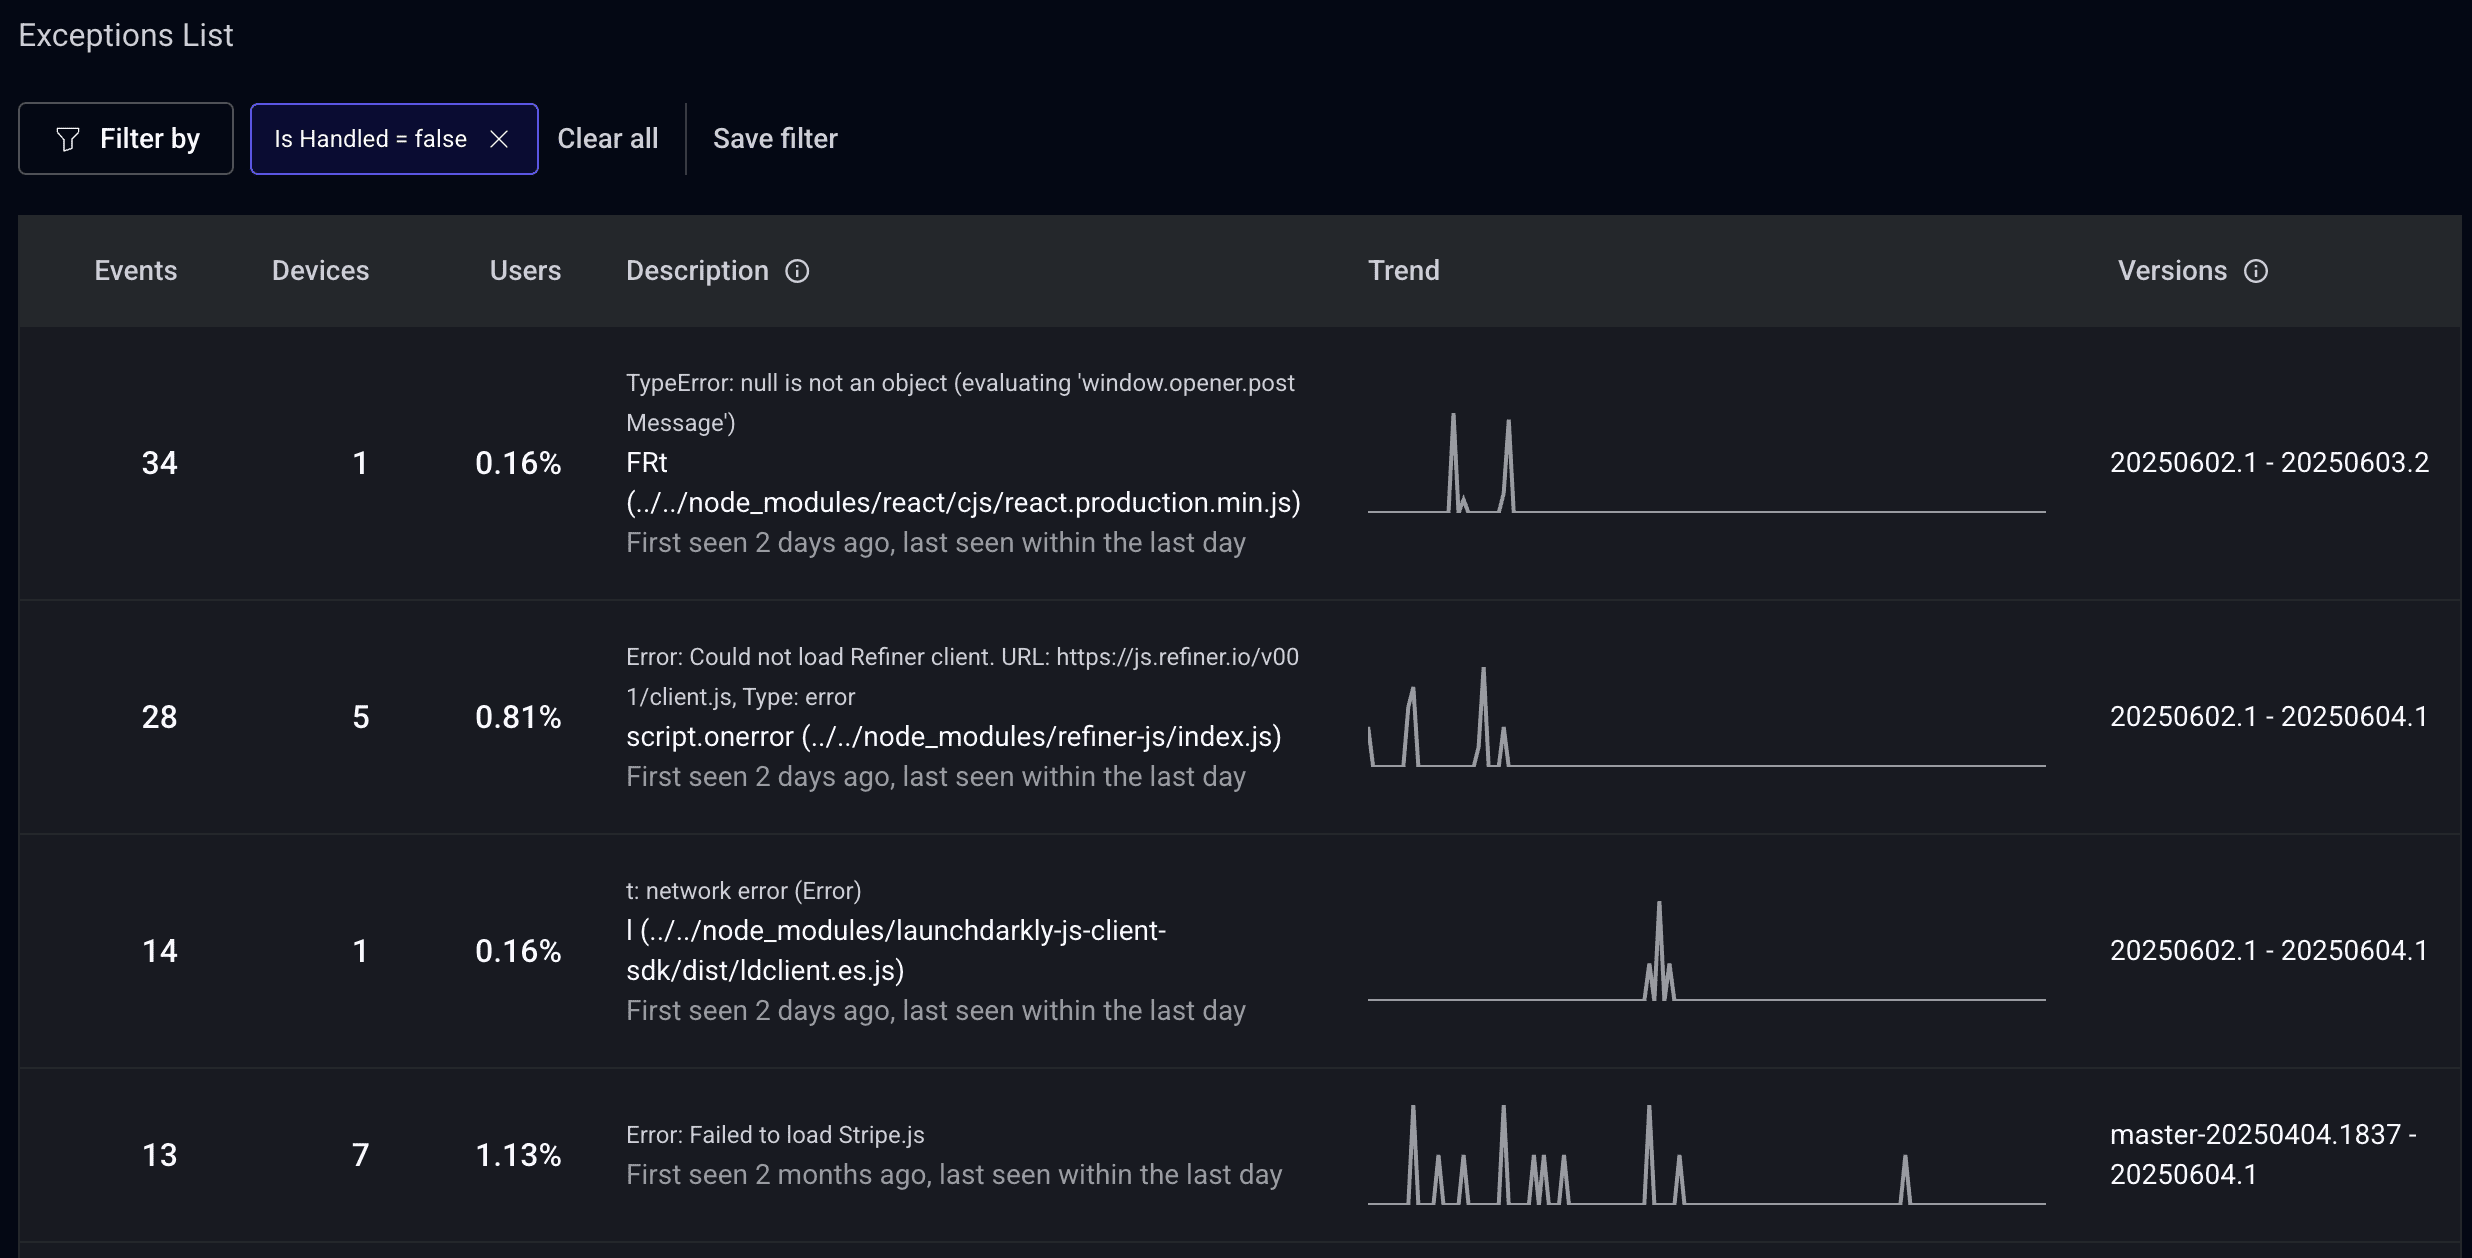
In the Embrace dashboard, you start off by viewing a summary page of all exceptions. Aggregated metrics allow you to spot high-level trends and patterns, while a list of exceptions lets you dive into individual issues based on how many users they’re impacting. From there you can dig into any unique exception to view a stacktrace, and then actually see an instance of that exception in a single user’s timeline of their unique web session. This provides the full context you need to truly understand the conditions and behaviors that preceded the error, so you don’t have to spend time manually triggering and reproducing the issue. All of the steps are there for you to retrace already. 

This holistic view helps frontend, platform, and product teams work together to resolve the most impactful issues, faster.

A better way to monitor the frontend

JavaScript exceptions create real disruptions to user experiences. Having a tool that not only captures these issues in aggregate, but that provides you with the detailed context you need to properly troubleshoot them, can go a long way in helping you to optimize your app performance. 

Whether you’re debugging a broken feature, measuring release health, or ensuring that your high-value funnels are performing flawlessly, Embrace gives you the insights you need to ship better experiences, every time.

Check out our docs for more detail about our JavaScript exception morning capabilities, or get started with Embrace yourself for free. 

If you’d like to learn more about Embrace’s Web RUM product from the engineers who built it, join our webinar on July 26th. 

Embrace Join our Web RUM webinar

Learn more about Embrace's new Web RUM product from the engineers that built it.

Sign up
Related Content
Understand web performance through the eyes of your users
Resolving complex web application issues requires context. What were your end users trying to do before an error occurred? How were networking conditions at the time affecting their experience? How much longer than normal did certain interactions take, and were they attempted repeatedly? These are the types of insights that Embrace Web RUM's timeline feature provides, via a full trail of technical and behavioral events across the entire web session.
Understanding Core Web Vitals with Embrace Web RUM
Monitoring Core Web Vitals is critical to maintain performant websites. Not only do these scores indicate baselines of user satisfaction, but they influence Google's rankings of websites. Sub-par CWVs can actually impact commercial elements of website success, like conversions, abandons, and return visits. That's why we designed Embrace's new Web RUM product with tools for deep analysis and highly granular around Core Web Vitals.