Introducing Embrace Web RUM: User-focused observability is now available across web and mobile!

Learn more

Understand web performance through the eyes of your users

In the world of modern web development, performance issues are not just technical problems—they’re user experience problems. A slow-loading page, a broken interaction, or an unresponsive button can mean the difference between conversion and churn.

But traditional web monitoring tools leave a crucial gap: they tell you what went wrong, but not who it affected, how it happened, or why it matters in the context of real user behavior.

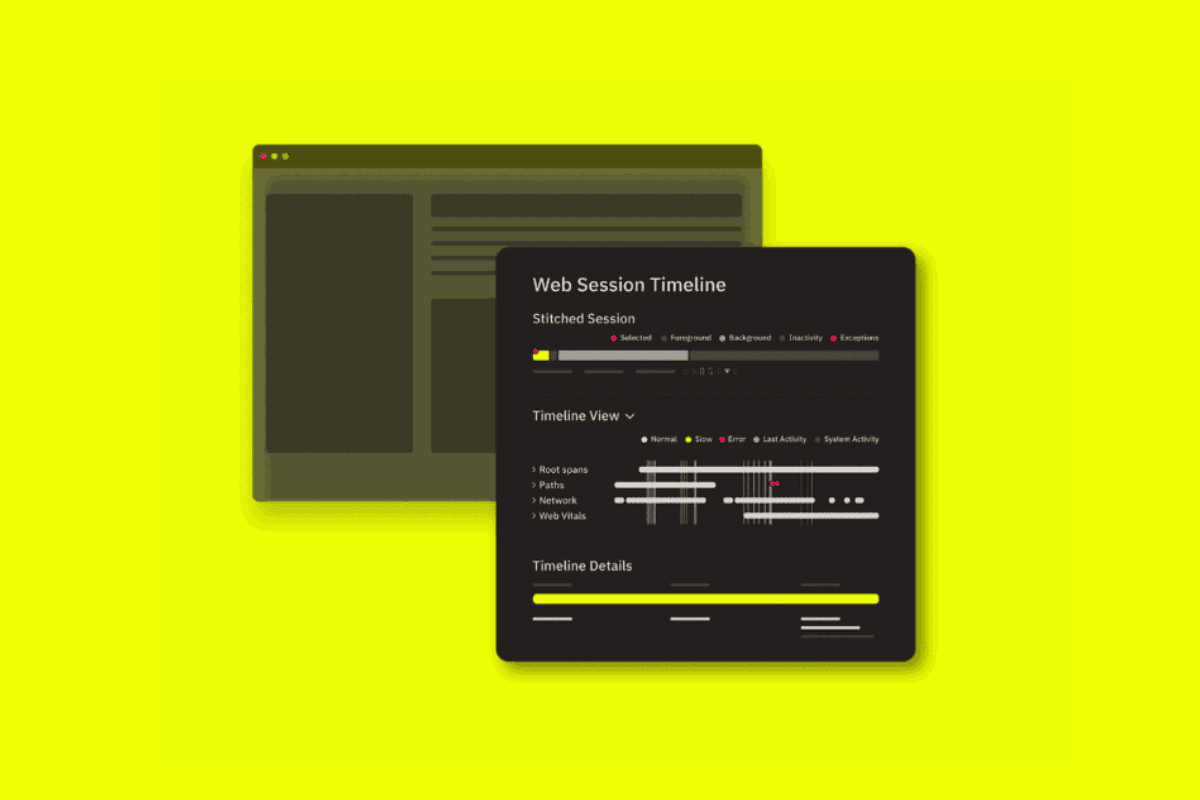
Embrace Web RUM is different. One of our core capabilities is the User Timeline—a trail of all technical and behavioral events that lets you go beyond fragmented logs and aggregated dashboards to understand every step of a complete user journey.

Understanding the Embrace User Timeline

The Embrace User Timeline is a detailed, chronological play-by-play of everything that happened during a real user’s session, from initial page load to the end of a session.

This timeline includes:

  • Page navigations and route changes
  • User actions and interactions (e.g. clicks, scrolls, form inputs)
  • JavaScript exceptions and errors
  • Performance metrics like Largest Contentful Paint (LCP)
  • Layout shifts and rendering issues 
  • Network requests, asset loading, and slow responses
  • Custom events and product-specific instrumentation, such as user flows and activities

All of this is stitched together in a single, unified view that shows not just what happened but when and in what order, giving you unmatched visibility into the user experience.

Why it matters for web performance monitoring

Let’s say you’re seeing an uptick in bounce rates on your pricing page. Traditional RUM tools might show that LCP is slower than usual or that an error rate has increased. But those aggregate signals don’t help you explain the problem or actually help you fix it. 

Embrace, on the other hand, gives you the full context into what your end user was doing in the lead-up to the issue. Instead of having to try and manually reproduce certain conditions or try and “trigger” an error in your own environment before attempting to resolve it, you can isolate the real user sessions that experienced the issue and retrace the actual steps those users took. 

Analyzing these sessions in the User Timeline might illuminate causal factors associated with the issue you’re analyzing, such as: 

  • A slow third-party script delaying render
  • A layout shift that caused a CTA button to jump out of view
  • A user click that triggered a failed network request
  • A JavaScript exception that broke a carousel component

With full visibility into both the behavior and the underlying performance data, you have the context you need to troubleshoot an issue quickly and effectively. 

This level of insight also fosters collaboration across engineering teams. Developers can diagnose and fix bugs faster, QA can validate real-world issues, and product managers can quantify how performance impacts engagement and conversion.

Designed for real users

Embrace’s User Timeline is different from other monitoring solutions in the market because it’s designed for true user-centric observability. While most performance tools let you visualize high-level metrics and dashboards, Embrace focuses on the individual user and their full experience. 

Every session timeline is directly tied to a real person using your site or app, in their real environment, with their browser, their device, and their network conditions. That means you can isolate issues affecting specific cohorts (like mobile Safari users or users on slower connections), helping you prioritize fixes that will drive the biggest impact.

Embrace automatically captures these sessions without sampling. That means you won’t miss the long tails, edge cases, or intermittent bugs that can easily be missed when relying on metrics-based tooling or error-only reporting. 

A faster path to issue resolution

The hardest part of debugging web performance issues often is not knowing that something went wrong, but rather knowing why and how.

The Embrace User Timeline is designed to give you exactly this type of insight. It accelerates time-to-resolution by providing: 

  • Full session context, not just isolated events
    Reproducibility, without needing to rely on user reports
  • Impact on actual users, so you can understand how performance is driving behavior

Whether you’re chasing down a slow funnel, investigating a spike in JS exceptions, or trying to understand how recent code changes affected UX, the User Timeline helps you move quickly from signal to solution. 

Learn more

Read to explore it for yourself? Check out our docs for more in-depth detail about the Embrace User Timeline and all the data it captures. If you’re looking to get started for yourself, you can create a free account and start sending sessions to Embrace today. 

Embrace Deliver incredible mobile experiences with Embrace.

Get started today with 1 million free user sessions.

Get started free
Related Content
Monitor JavaScript exceptions with Embrace
Capturing and resolving JavaScript exceptions is a core element of any web RUM tool. With Embrace, engineers can tackle even the trickiest exceptions using advanced analytical tools.
Understanding Core Web Vitals with Embrace Web RUM
Monitoring Core Web Vitals is critical to maintain performant websites. Not only do these scores indicate baselines of user satisfaction, but they influence Google's rankings of websites. Sub-par CWVs can actually impact commercial elements of website success, like conversions, abandons, and return visits. That's why we designed Embrace's new Web RUM product with tools for deep analysis and highly granular around Core Web Vitals.