Introducing Embrace Web RUM: User-focused observability is now available across web and mobile!

Learn more

How to make sense of iOS user activity with OpenTelemetry

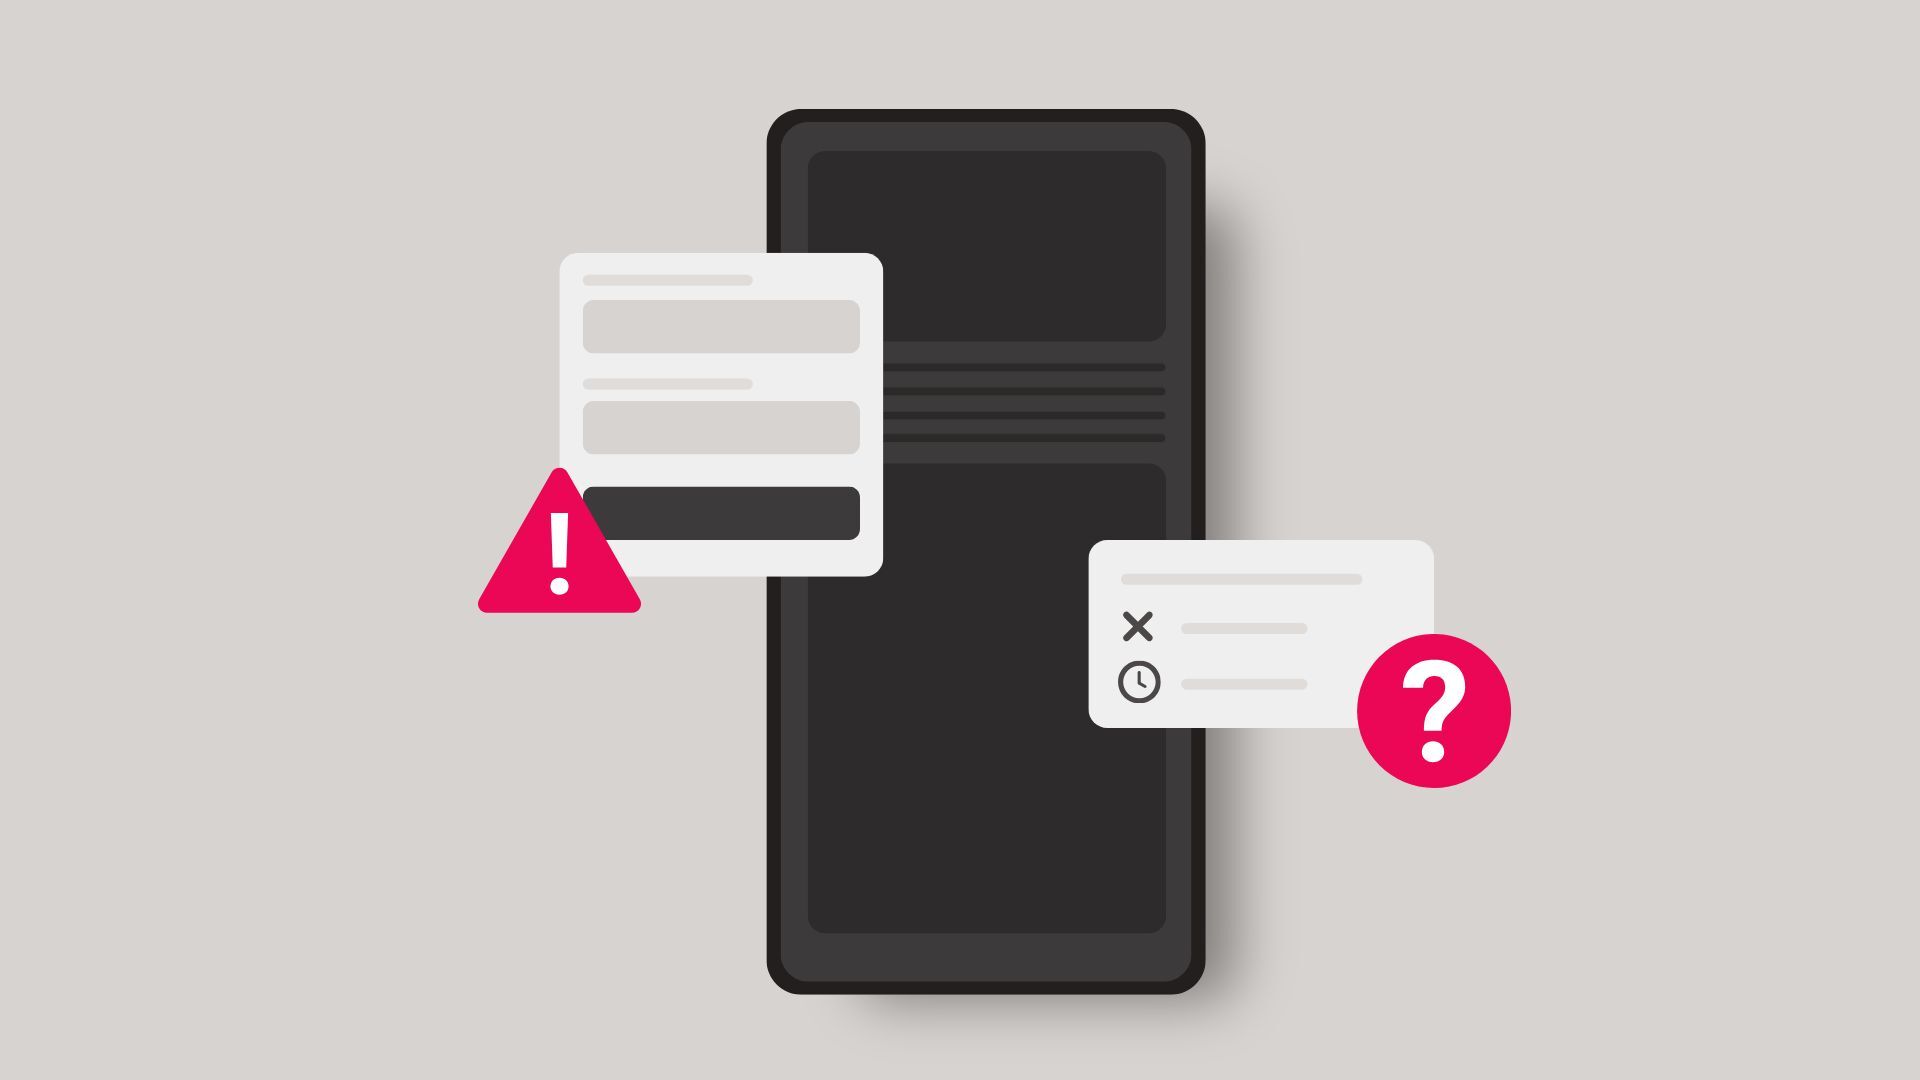
Software engineers build software systems and release them into the world. When building and afterwards, engineers want real-time feedback about how the system acts, performs and breaks.

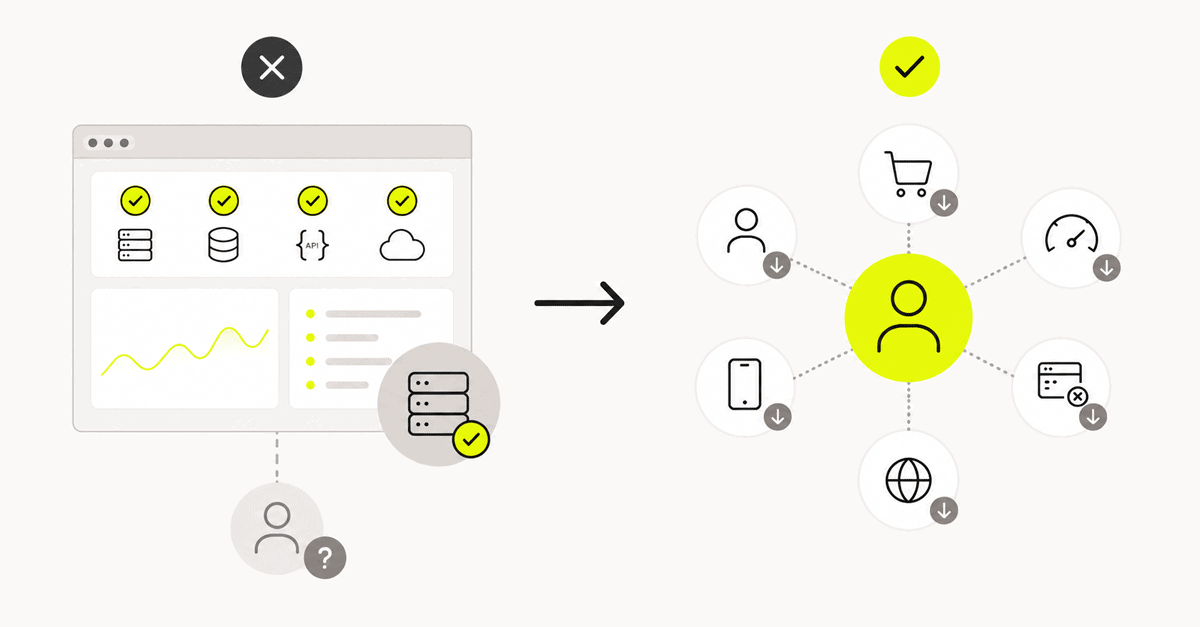
This practice is called observability, which is the act of collecting signals, or telemetry, from an application while it’s live and using those signals to ask questions about the application. Observability’s value comes from a truth that all developers eventually learn: Stuff always happens when you release apps, and the best way to deal with that is to gather as much information as possible about the application to make hypotheses about the causes.

OpenTelemetry is a massively popular set of tools for asking just these kinds of questions. OpenTelemetry, or OTel for short, offers a standardized way for developers to transmit application information, currently metrics, logs, and traces, in nearly any popular programming language. Apps in any setting can send the same types of data to their observability backend, creating a standard that is recognizable, intelligible, and usable for any OTel-informed person.

One area of OpenTelemetry, and observability in general, that is still building toward a consensus is in observing mobile apps. Mobile observability has to take into account many factors that don’t exist for web services or databases, such as battery life or user experience. Let’s explore how OTel can still solve problems unique to mobile observability using the tools that already exist.

OpenTelemetry instrumentation

OpenTelemetry allows developers to add telemetry to their apps using one of a dozen robustly supported language APIs and SDKs. Each of these toolkits is created according to a specification that exists across the OTel ecosystem, and each provides easy instrumentation for gathering OTel signals in an application.

For example, here’s what a trace looks like using the OTel-Swift instrumentation:

// Set up the tracer
let tracer = OpenTelemetry.instance.tracerProvider
                .get(
                  instrumentationName: "instrumentation-library-name",
                  instrumentationVersion: "1.0.0"
                 )

// Start a span to trace an activity in the app
let span = tracer.spanBuilder(spanName: "start-activity")
             .startSpan()

// End the span after all the activity is completed

span.end()

A key aspect of observability tooling is that code should be instrumented when it is written. It is easier to have application code directly inform its telemetry than it is to guess at what occurred from the outside:

~~~~~~~~~~~~~~~~~~~~~~~~~~~~~~~~~~~~~~~~~~~~~~~~~~~~~~~~~~~~~~~~~~~~~~~~

// Situation 1: Telemetry isn’t tied directly to functionality
func myFunction() {
  action.start()

  while.action.state != .ended {
    if action.result == .interrupted {
      action.start()
    } else {
      continue
    }
  }
}

// When calling myFunction, we can only guess at when the functionality began and ended
// We also know nothing about what happened in the function
let span = tracer.spanBuilder(spanName: "myFunction")
             .startSpan()
myFunction()
span.end()

~~~~~~~~~~~~~~~~~~~~~~~~~~~~~~~~~~~~~~~~~~~~~~~~~~~~~~~~~~~~~~~~~~~~~~~~

// Situation 2: Telemetry is tied to functionality
func myFunction() {
  action.start()
  // We can begin tracing the action right when it starts
  let span = tracer.spanBuilder(spanName: "myFunction")
             .startSpan()

  while.action.state != .ended {
    if action.result == .interrupted {
      // We can note information about the execution of our function
      span.addEvent(
          name: “action interrupted”,
          timestamp: Date.now
      )

      action.start()
    } else {
      continue
    }
  }

  // We can end the span right when the action completes
  span.end()
}

// Calling the function will include the instrumentation
myFunction()

Adding instrumentation in this way allows developers to encapsulate the entire context of an operation within the telemetry that the operation generates, without any interpretation or loose ends.

This tooling is up to the task of most things mobile developers want to do. However, the OTel specification originated from observability use cases for Kubernetes clusters and backend systems, which can sometimes result in unaccounted-for scenarios on mobile. The information gathered by OTel focuses heavily on items like resources, which largely don’t affect mobile, while crucial mobile activity like app crashes don’t presently have a conceptual model in OTel. More fundamentally, mobile apps are single, compiled pieces of software in production, rather than a set of microservices, and so their approach to tooling must be different.

The structure of mobile apps

The structure of mobile applications presents a complicated case for OTel tooling. iOS and Android apps must be published to their respective app stores by transmitting a single downloadable file. This means all app activity, and thus information about that app, is generated from a single codebase at the time that it’s compiled.

Imagine one codebase that holds the specifics of UI elements, networking, user authentication details, and on-device SQLite storage, to name a few. These capabilities all must exist for a live mobile app to function correctly, but for the developer, this is a mess of interrelated folders to maintain:

Native services

Adding to the complexity, each of these capabilities can depend on the others to even get the app running.

For example, a user token manager might need to retrieve its token from local storage, then use the networking library to double-check with an auth service that the token is still valid, and then trigger a navigation update for the authenticated user to bring them further into the app experience. Writing this all in one project, and then tracing that single process using OTel, can create a mess of overlapping responsibilities and black boxes:

// Workflow root
let authRootSpan = tracer.spanBuilder(spanName: "auth-root")
             .startSpan()

// Retrieve the auth token
let token = TokenManager.retrieveToken()

// Add to the Auth root a span for retrieving the auth token
// Issue: we don’t know any of the internals of the .retrieveToken() call, or even when it will complete
let retrieveAuthTokenSpan = tracer.spanBuilder(spanName: "retrieve-auth-token")
                                  .setParent(authRootSpan)
                                  .startSpan()

// Send auth token to web service for verification
let response = NetworkingManager.verify(authToken: token)

// Add to the Auth root a span for this request
// Issue: we don’t know any of the internals of the .verify call, or when it will complete. 
// This is especially egregious for networking, as we’d like to know the full details of ~what happened~ during a request
let verifyAuthTokenRequestSpan = tracer.spanBuilder(spanName: "verify-auth-token")
                                  .setParent(authRootSpan)
                                  .startSpan()

// ...There will continue to be a similar pattern of issues for this approach

This work shouldn’t all be happening in one place!

Building an interface-based approach to OTel

To manage this complexity, mobile developers often organize their monolithic apps into separate modules with limited dependencies. These modules each manage the responsibilities of their own capabilities, and try to expose only the interface that other modules can use:

Splitting app capabilities into their own modules comes with the built-in benefit of access control: A module exposes only the functionality that the developer allows it to expose. For example, in the following code, only the `makeRequest` function can be accessed elsewhere:

// in RunningApp-Networking

public struct RequestHelper() {
  // Inaccessible to others 
  private setupRequest() {}
  private teardownRequest() {}

  // Accessible to others
  public makeRequest() -> Result {
    setupRequest()
    defer {
        teardownRequest()
    }
    // do request logic
    return Result.success
  }
}

~~~~~~~~~~~~~~~~~~~~~~~~~~~~~~~~~~~~~~~~~~~~~~~~~~~~~~~~~~~~~~~~~~~~~~~~

// In other modules, we can get the Result object
import RunningApp-Networking

let networkingResult = RequestHelper.makeRequest()

The important step here: Using `RequestHelper.makeRequest` will return a `Result` object to other modules in the app. We can use a similar pattern of returning objects for OTel instrumentation between modules and return only the information that another module might need:

// in RunningApp-Networking

public struct RequestHelper() {
  private setupRequest() {}
  private teardownRequest() {}

  public makeRequest() -> (result: Result, processStartTime: Date) {
    let startTime = Date.now
    setupRequest()
    defer {
        teardownRequest()
    }
    // do request logic
    return (result: Result.success, processStartTime: startTime)
  }
}

~~~~~~~~~~~~~~~~~~~~~~~~~~~~~~~~~~~~~~~~~~~~~~~~~~~~~~~~~~~~~~~~~~~~~~~~

// In other modules
import RunningApp-Networking

let (networkingResult, networkingStartTime) = RequestHelper.makeRequest()
let networkingRequestSpan = tracer.spanBuilder(spanName: "networking")
                              .setStartTime(time: networkingStartTime)
                              .startSpan()

We can further iterate on the specific information that’s shared, but why not instead use a shared data format and language? If only there was a set of tooling that would allow us to standardize the telemetry that’s collected and transmitted across different app boundaries, without needing to customize the format of the information being transmitted each time.

We can have our modules use OpenTelemetry to communicate between themselves! By passing spans as return types in the interfaces, modules can communicate their own telemetry and combine them with telemetry from other parts of the app before transmitting them off-device. We can also decorate the telemetry with whatever additional attributes and events we want to attach, without changing the shared data model. Adding this rich context to telemetry is the key to understanding and reproducing the issues affecting your users:

// in RunningApp-Networking

public struct RequestHelper() {
  private setupRequest() {}
  private teardownRequest() {}

  public makeRequest() -> (result: Result, span: Span) {
    var span = tracer.spanBuilder(spanName: "networking")
                 .setStartTime(time:Date.now)
    setupRequest()
    defer {
        teardownRequest()
    }
    // do request logic

    // we can decorate the span with any pertinent information
    // maybe being in low power mode is affecting the outcome
    span.setAttribute(key: ”is-low-power-mode”, value: true)

    // maybe certain operating systems experience worse networking outcomes
    span.setAttribute(
      key: “operating-system”, 
      value: UIDevice.current.systemVersion
    )
    return (result: Result.success, span: span)
  }
}

~~~~~~~~~~~~~~~~~~~~~~~~~~~~~~~~~~~~~~~~~~~~~~~~~~~~~~~~~~~~~~~~~~~~~~~~

// In other modules
import RunningApp-Networking

let largerProcessSpan = tracer.spanBuilder(spanName: "larger-process")
                              .startSpan()

let (networkingResult, networkingSpan) = RequestHelper.makeRequest()

networkingSpan.setParent(largerProcessSpan)
              .startSpan()

This approach allows us to share wholly-formed telemetry between modules, without making the other modules responsible for the details or the purpose of that telemetry. This is the goal of telemetry, after all: reporting on the factors that affect all parts of our system while it’s live. Developers can model different parts of an app as separate services and create a whole picture afterwards.

Using OTel context

Before wrapping up, we should mention the idea of context, which is built directly into all the OTel SDKs. Context “contains the information for the sending and receiving service, or execution unit, to correlate one signal with another.” In other words, it shares information about a given service with the other services it communicates with so that their telemetry can be combined in any number of ways.

This is an exciting opportunity for mobile observability in particular, as app developers benefit from understanding the telemetry being collected at a given point in time regardless of its location in the app. In an iOS application, you can check the OpenTelemetry SDK for the span that’s active at that time:

let currentSpan = OpenTelemetry.instance.contextProvider.activeSpan

However, using the OTel interface in this way leaves to chance a number of scenarios. Mobile devices are multicore computers that can run a number of processes all at once. Which would be the “active span” that’s being measured if a network request is running in the background and the screen is scrolling? And how does the “active span” account for asynchronous operations, which are especially concerning for data integrity in networking and local storage? These are standard concerns with singletons in mobile development, but still worth accounting for when approaching the context of an app’s telemetry.

Wrapping up

OpenTelemetry’s standardized concepts and toolkits allow developers to share information across system boundaries in a predictable way. In mobile development, robust instrumentation with OTel can tell developers what’s happening at every layer of their code. Further, treating OTel as an information-sharing abstraction allows mobile developers to standardize the structure that their apps will send information in.

At Embrace, we’re looking to grow the capabilities of the information that is captured on mobile, to make it easy to know exactly what affects the user experience. Join our community Slack to ask questions and find out more about our approach to OTel and our journey.

Embrace Deliver incredible mobile experiences with Embrace.

Get started today with 1 million free user sessions.

Get started free
Related Content