
This article explores how observability platforms work, their core components, and how they differ from individual observability tools, offering clear guidance for teams seeking to enhance their application performance and reliability.
In today’s complex digital landscape, understanding what is an observability platform is essential for organizations aiming to maintain robust, high-performing applications. Observability platforms provide a unified approach to monitoring, analyzing, and optimizing application health and user experience. This article explores how observability platforms work, their core components, and how they differ from individual observability tools, offering clear guidance for teams seeking to enhance their application performance and reliability.
What Is an Observability Platform and How It Works
An observability platform is a comprehensive solution designed to collect, correlate, and analyze data from various sources within your technology stack. Unlike traditional monitoring tools that focus on predefined metrics or logs, observability platforms provide deep visibility into the internal state of systems by aggregating telemetry data—such as logs, metrics, and traces—across distributed environments.
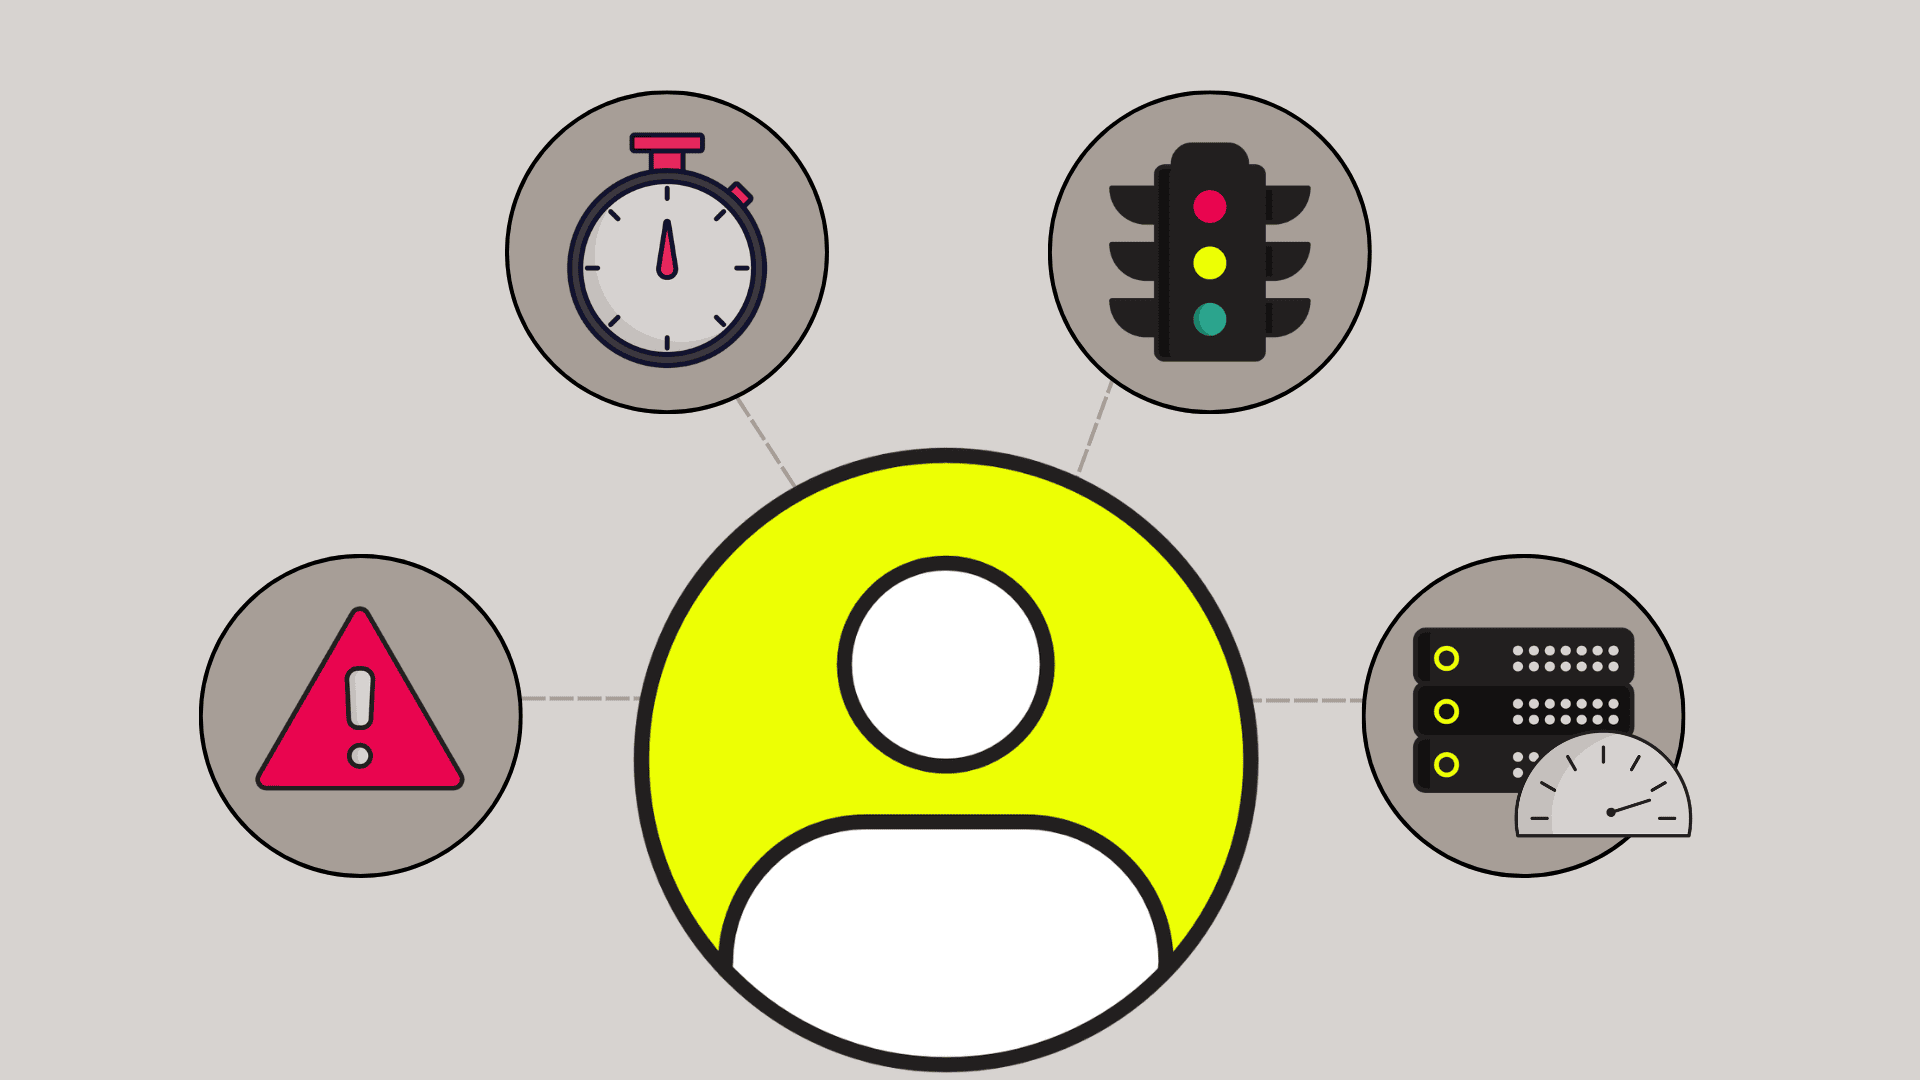
The primary goal of an observability platform is to help teams detect, investigate, and resolve issues quickly. By centralizing data from multiple sources, these platforms enable users to answer critical questions about system behavior, performance bottlenecks, and user experience anomalies. For example, if a mobile application experiences slow startup times, an observability platform can help pinpoint whether the issue stems from backend latency, client-side errors, or network disruptions. For teams focused on mobile app performance, solutions like App Performance by Embrace offer insights that help identify and address these bottlenecks efficiently.
Observability platforms work by instrumenting applications and infrastructure to automatically collect telemetry data. This data is then processed and visualized through dashboards, alerts, and analytics tools, empowering teams to proactively identify and address issues before they impact end users.
Core Components and Features of Observability Platforms
A robust observability platform typically includes several core components and features that work together to provide comprehensive system insight:
1. Telemetry Data Collection
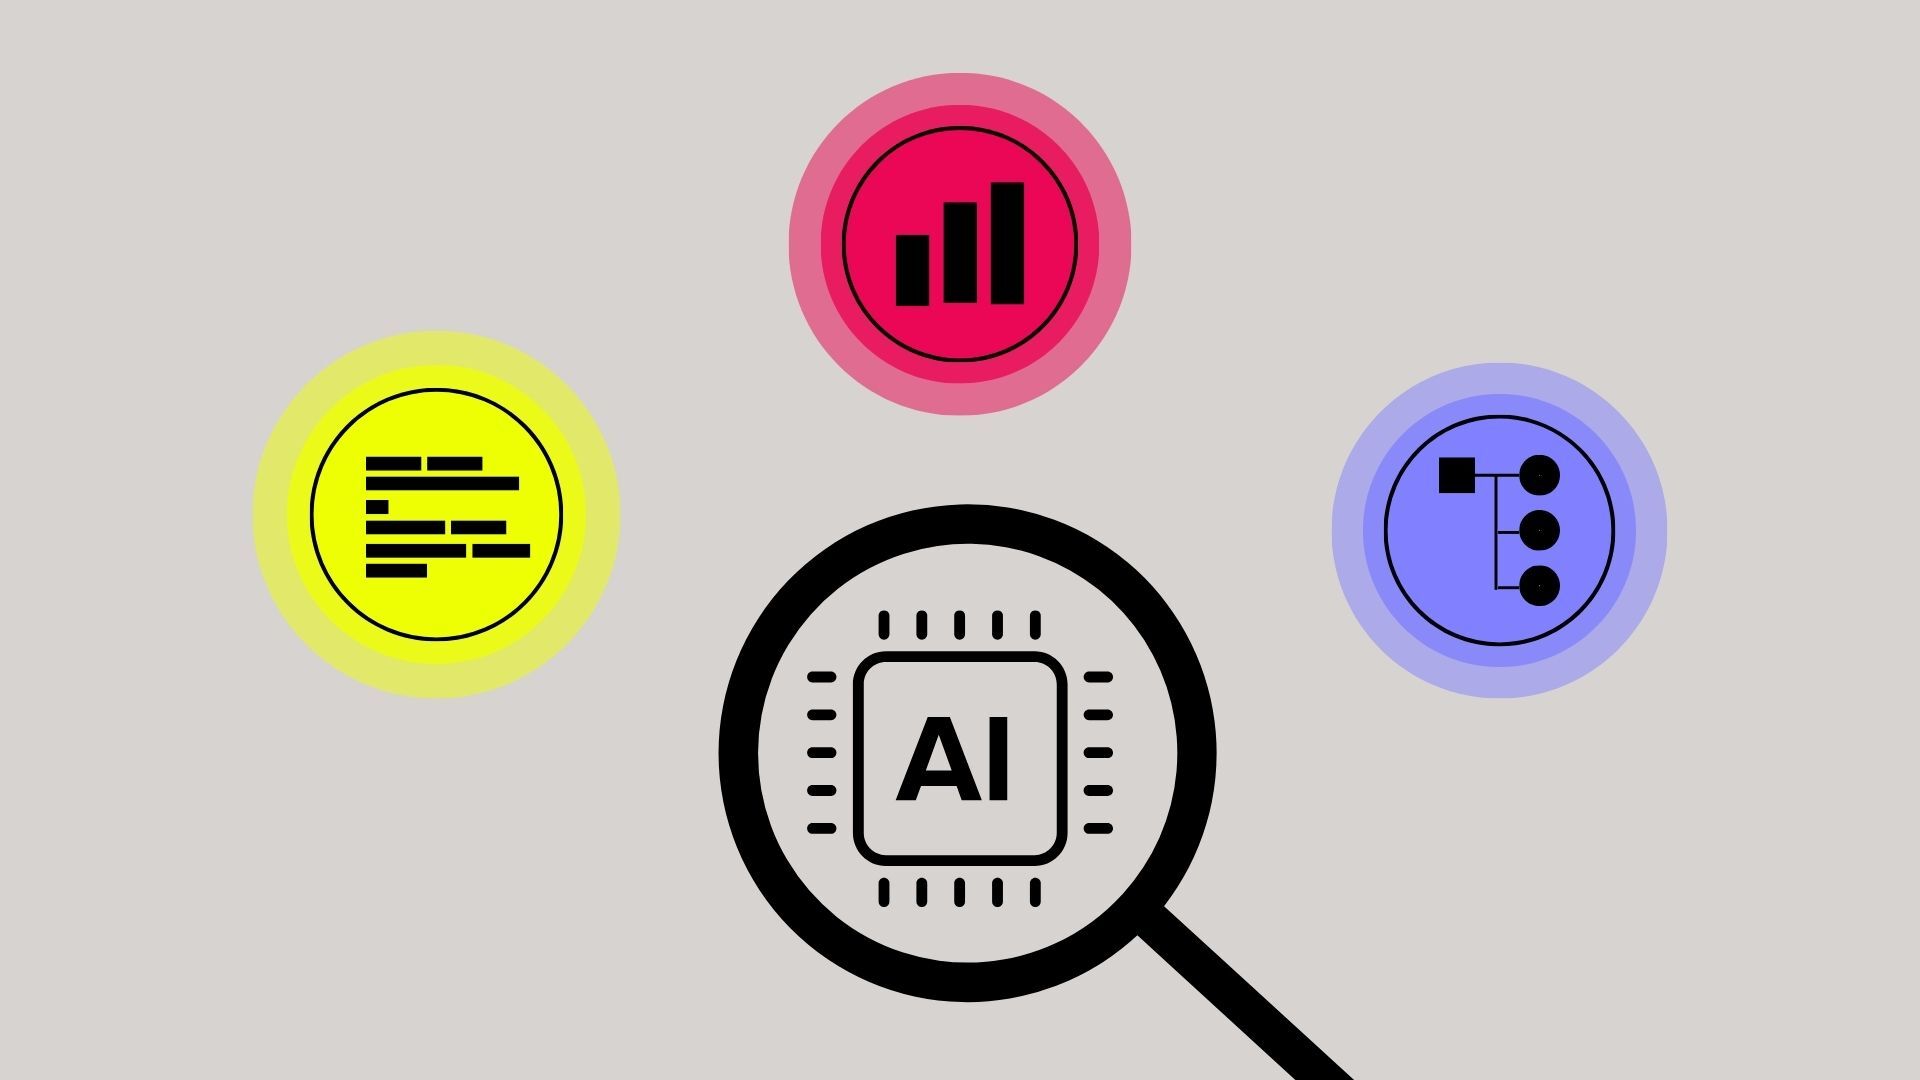
Observability platforms gather three primary types of telemetry data:
- Metrics: Quantitative measurements such as CPU usage, memory consumption, and request rates.
- Logs: Time-stamped records of discrete events, errors, or informational messages generated by applications and infrastructure.
- Traces: End-to-end records of requests as they travel through distributed systems, providing context for performance analysis and root cause identification.
2. Data Correlation and Contextualization
A key feature of observability platforms is the ability to correlate data across different sources and layers of the stack. By linking metrics, logs, and traces, teams can gain a holistic view of system behavior and quickly trace issues from symptoms to root causes. For instance, leveraging User Timeline Insights allows teams to connect user experiences directly to backend events for more effective troubleshooting.
3. Real-Time Analytics and Visualization
Observability platforms provide interactive dashboards, visualizations, and analytics tools that allow users to explore data in real time. These features enable teams to monitor key performance indicators (KPIs), track trends, and identify anomalies as they occur. Custom dashboards, such as those found in Embrace’s Custom Dashboards, make it easy to tailor analytics to your unique needs.
4. Alerting and Automated Response
Automated alerting is essential for proactive incident management. Observability platforms can trigger alerts based on predefined thresholds or detected anomalies, ensuring that teams are notified of potential issues before they escalate. Explore our Alerting capabilities for customizable, real-time notifications.
5. Integration and Extensibility
Modern observability platforms integrate with a wide range of tools and services, including cloud providers, CI/CD pipelines, and third-party monitoring solutions. This extensibility allows organizations to tailor observability to their unique environments and workflows.
Observability Platform vs. Individual Observability Tools
While individual observability tools—such as log aggregators, metrics collectors, or tracing solutions—offer valuable insights into specific aspects of system performance, they often operate in isolation. This siloed approach can make it challenging to correlate data, identify root causes, and maintain a unified view of application health.
In contrast, an observability platform consolidates these capabilities into a single, cohesive solution. By centralizing telemetry data and providing integrated analytics, observability platforms enable teams to:
- Reduce operational complexity by eliminating the need to manage multiple disparate tools.
- Accelerate incident response through unified dashboards and cross-source correlation.
- Enhance collaboration between development, operations, and support teams.
- Gain deeper, end-to-end visibility into distributed systems and user experiences.
For organizations managing complex, distributed applications—such as those supporting global user bases or mobile platforms—an observability platform is essential for maintaining performance, reliability, and user satisfaction.
Take Control of Your Application Performance Today
Ready to experience the benefits of a unified observability platform? Empower your team to detect, diagnose, and resolve issues faster—improving reliability and user satisfaction. See how a modern observability platform can transform your approach to application monitoring and performance optimization.
Frequently Asked Questions
An observability platform is a unified solution that collects, correlates, and analyzes telemetry data (metrics, logs, traces) from applications and infrastructure. It is important because it enables teams to proactively detect, investigate, and resolve issues, ensuring optimal performance and user experience.
Traditional monitoring tools focus on predefined metrics and alerting, often lacking context for complex issues. An observability platform provides deeper visibility by correlating metrics, logs, and traces, allowing teams to understand the 'why' behind system behavior.
While individual tools can provide insights into specific areas, they often operate in silos. An observability platform integrates these capabilities, offering a holistic view and streamlining incident response.
Key features include comprehensive telemetry data collection, real-time analytics, data correlation, automated alerting, and integration with existing tools and workflows.