Key Android performance monitoring metrics
Learn the essential Android performance metrics—startup time, UI rendering, crashes, ANRs, network speed, and resource usage—to improve app speed and stability.
Understanding and optimizing Android performance monitoring metrics is essential for delivering a seamless user experience and maintaining app reliability. Whether you are a developer, product manager, or technical lead, monitoring these metrics provides actionable insights into your app’s health and performance.
This article explores the most critical Android performance monitoring metrics, offering clear explanations, practical examples, and actionable advice to help you enhance your app’s performance.
App startup time: Measuring and optimizing launch performance
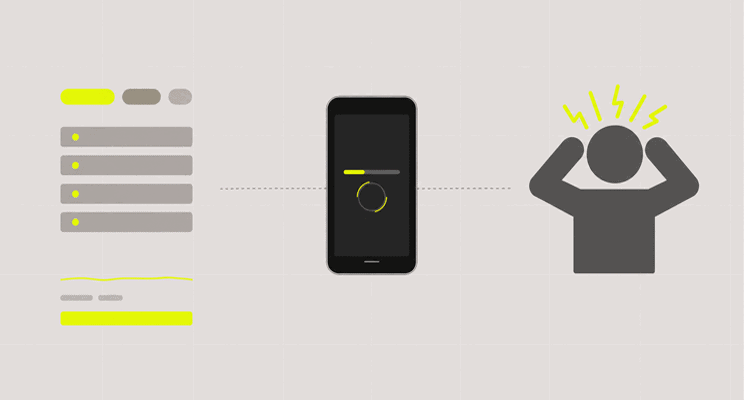
App startup time is a foundational Android performance monitoring metric. It measures the duration from when a user taps your app icon to when the app becomes interactive. Slow startup times can lead to user frustration and increased abandonment rates.
Why startup time matters
- First impressions: Users expect apps to launch quickly. Delays can negatively impact user retention.
- Technical debt: Long startup times often indicate underlying inefficiencies in code or resource loading.
How to measure startup time
- Cold start: The app is launched from scratch, with no process in memory.
- Warm start: The app process is in memory but not in the foreground.
- Hot start: The app is already running in the background.
Tools like Android Studio Profiler and Firebase Performance Monitoring can help you instrument and analyze startup times. For an advanced approach, explore mobile app performance monitoring to gain deeper insights and ensure optimal launch experiences. Aim for a cold start time under two seconds for the best user experience.
Optimization strategies
- Lazy loading: Defer non-essential initialization until after the app is interactive.
- Reduce main thread work: Offload heavy computations to background threads.
- Optimize asset loading: Compress images and minimize resource sizes.
Frame rendering and UI responsiveness metrics
Frame rendering metrics assess how smoothly your app’s user interface responds to user interactions. The most common metric is Frames Per Second (FPS), which measures how many frames are rendered each second.
Key metrics
- Jank: Occurs when frames take too long to render, causing visible stutters.
- Dropped frames: Indicates frames that were not rendered in time, leading to choppy animations.
Monitoring tools
- Android Studio layout inspector: Visualizes UI rendering performance.
- Systrace and GPU rendering profilers: Provide detailed frame timing data.
- Embrace: Offers comprehensive UI performance tracking with real-time frame drop detection and detailed session replays.
For holistic performance profiling and troubleshooting of your Android app’s UI responsiveness, leverage tools that highlight frame drops and UI bottlenecks.
Best practices
- Minimize main thread work: Keep UI thread tasks under 16ms to maintain 60 FPS.
- Optimize layouts: Use efficient view hierarchies and avoid overdraw.
- Profile regularly: Continuously monitor UI performance, especially after updates.
Crash rate and app stability monitoring
Crash rate is a critical Android performance monitoring metric that directly impacts user trust and app ratings. Monitoring crash rates helps identify stability issues and prioritize fixes.
Measuring crash rate
- Crash-free users: Percentage of users who did not experience a crash.
- Crash-free sessions: Percentage of sessions without a crash.
Tools for monitoring
- Firebase Crashlytics: Provides real-time crash reporting and stack traces.
- Sentry and Bugsnag: Offer advanced error tracking and alerting.
- Embrace: Delivers robust crash reporting with actionable diagnostics, real-time alerts, and complete session context to understand the user journey leading to crashes.
Reducing crash rates
- Proactive testing: Implement automated and manual testing for edge cases.
- Error handling: Use robust exception handling and input validation.
- Monitor third-party SDKs: Ensure dependencies are stable and up-to-date.
App not responding (ANR) events and their impact
ANR events occur when the app’s main thread is blocked for more than five seconds, causing the system to display an “App Not Responding” dialog. ANRs are a significant Android performance monitoring metric because they severely degrade user experience.
Causes of ANRs
- Long operations on main thread: Network calls, database queries, or heavy computations.
- Deadlocks: Improper thread synchronization.
Monitoring and prevention
- Android vitals: Surfaces ANR rates in the Google Play Console.
- StrictMode: Detects accidental disk or network access on the main thread during development.
- Embrace: Enhance visibility into ANR events with dedicated ANR reporting tools for faster detection, resolution, and complete thread trace analysis.
Mitigation strategies
- Move work off main thread: Use AsyncTask, HandlerThread, or Kotlin coroutines.
- Optimize synchronization: Avoid unnecessary locks and ensure efficient thread management.
Network performance metrics: latency, throughput, and error rates
Network performance is a vital aspect of Android performance monitoring metrics, especially for apps that rely on real-time data or cloud services.
Key metrics
- Latency: Time taken for a network request to receive a response.
- Throughput: Amount of data transferred over a period.
- Error rates: Frequency of failed network requests.
Monitoring tools
- Firebase performance monitoring: Tracks network request times and error rates.
- Charles proxy and wireshark: Analyze network traffic and bottlenecks.
- Embrace: For complete insight into mobile network operations, check out Mobile Network Insights for Android apps, offering detailed request tracking, error analysis, and performance optimization recommendations.
Optimization tips
- Efficient data fetching: Use pagination and caching to minimize network load.
- Retry logic: Implement exponential backoff for failed requests.
- Secure connections: Use HTTPS and validate SSL certificates.
Resource utilization: CPU, memory, and battery consumption
Efficient resource utilization is essential for maintaining app performance and device health. Monitoring CPU, memory, and battery usage helps identify leaks and inefficiencies.
CPU usage
- High CPU usage: Can cause device overheating and battery drain.
- Profiling tools: Android Studio CPU Profiler helps identify hotspots.
Memory usage
- Memory leaks: Lead to app slowdowns and crashes.
- Heap analysis: Use LeakCanary or Android Profiler to detect leaks.
Battery consumption
- Background tasks: Limit unnecessary background activity.
- Efficient scheduling: Use WorkManager for deferred or periodic tasks.
Monitoring tools
- Android Studio Profiler: Provides detailed CPU, memory, and energy profiling.
- Battery Historian: Analyzes battery consumption patterns over time.
- Embrace: Tracks resource utilization metrics in real-world conditions, helping you identify performance bottlenecks and optimize resource consumption across diverse device configurations.
Best practices
- Optimize algorithms: Use efficient data structures and algorithms.
- Release resources: Properly close database connections and unregister listeners.
- Monitor regularly: Continuously track resource usage, especially after updates.
Frequently Asked Questions (FAQs)
- What are the most important Android performance monitoring metrics to track?
The most important Android performance monitoring metrics include app startup time, frame rendering and UI responsiveness, crash rate, ANR events, network performance (latency, throughput, error rates), and resource utilization (CPU, memory, battery). - How can I reduce app startup time on Android?
Reduce app startup time by deferring non-essential initialization, optimizing asset loading, and minimizing work on the main thread. - Why do ANR events occur, and how can I prevent them?
ANR events occur when the main thread is blocked for too long. Prevent them by moving heavy operations off the main thread and optimizing thread synchronization. - Which tools are best for monitoring Android performance metrics?
Tools like Android Studio Profiler, Firebase Performance Monitoring, Crashlytics, LeakCanary, and Embrace are effective for tracking Android performance monitoring metrics. - How does network performance impact Android app user experience?
Poor network performance can lead to slow data loading, increased error rates, and user frustration. Monitoring and optimizing network latency, throughput, and error rates is essential.
Take Control of Your Android App Performance
Ready to elevate your app’s reliability and user experience? Start monitoring the key Android performance metrics that matter most. With comprehensive insights, you can proactively address issues, optimize performance, and deliver a seamless experience to your users.