WEBINAR Dec 16 | An OTel Carol: Past, Present, and Future of OpenTelemetry. Panelists discuss what OTel delivered in 2025, what improved, and what’s coming next.

Sign-up

A practical guide to client-side network monitoring

If you’ve ever debugged a slow screen, a stuck loading spinner, or a user complaint like “the app just wasn’t working,” then you’ve already felt the limits of backend-only monitoring.

Here’s the reality:

Most mobile network failures happen before a request ever reaches your backend.
Users don’t experience logs — they experience timeouts, network transitions, invalid requests, missing auth, offline states, and retry storms that occur entirely on the device.

This guide walks through the foundational steps for understanding those failures using Embrace’s client-side network monitoring, paired with short demo clips so you can follow along.

Let’s get started.
1. Understand why client-side visibility matters

Before jumping into tooling, it helps to understand what backend monitoring misses.

Mobile apps can fail before reaching your server due to:

  • lost or unstable signal
  • DNS or SSL errors
  • airplane mode
  • switching networks (Wi-Fi → LTE → offline)
  • malformed requests
  • missing auth headers
  • aggressive retries or long timeouts

These failures never appear in backend logs. Client-side monitoring shows what the device actually experienced.

This is the starting point for reliable debugging.

2. Open the network dashboard and check the breakdown

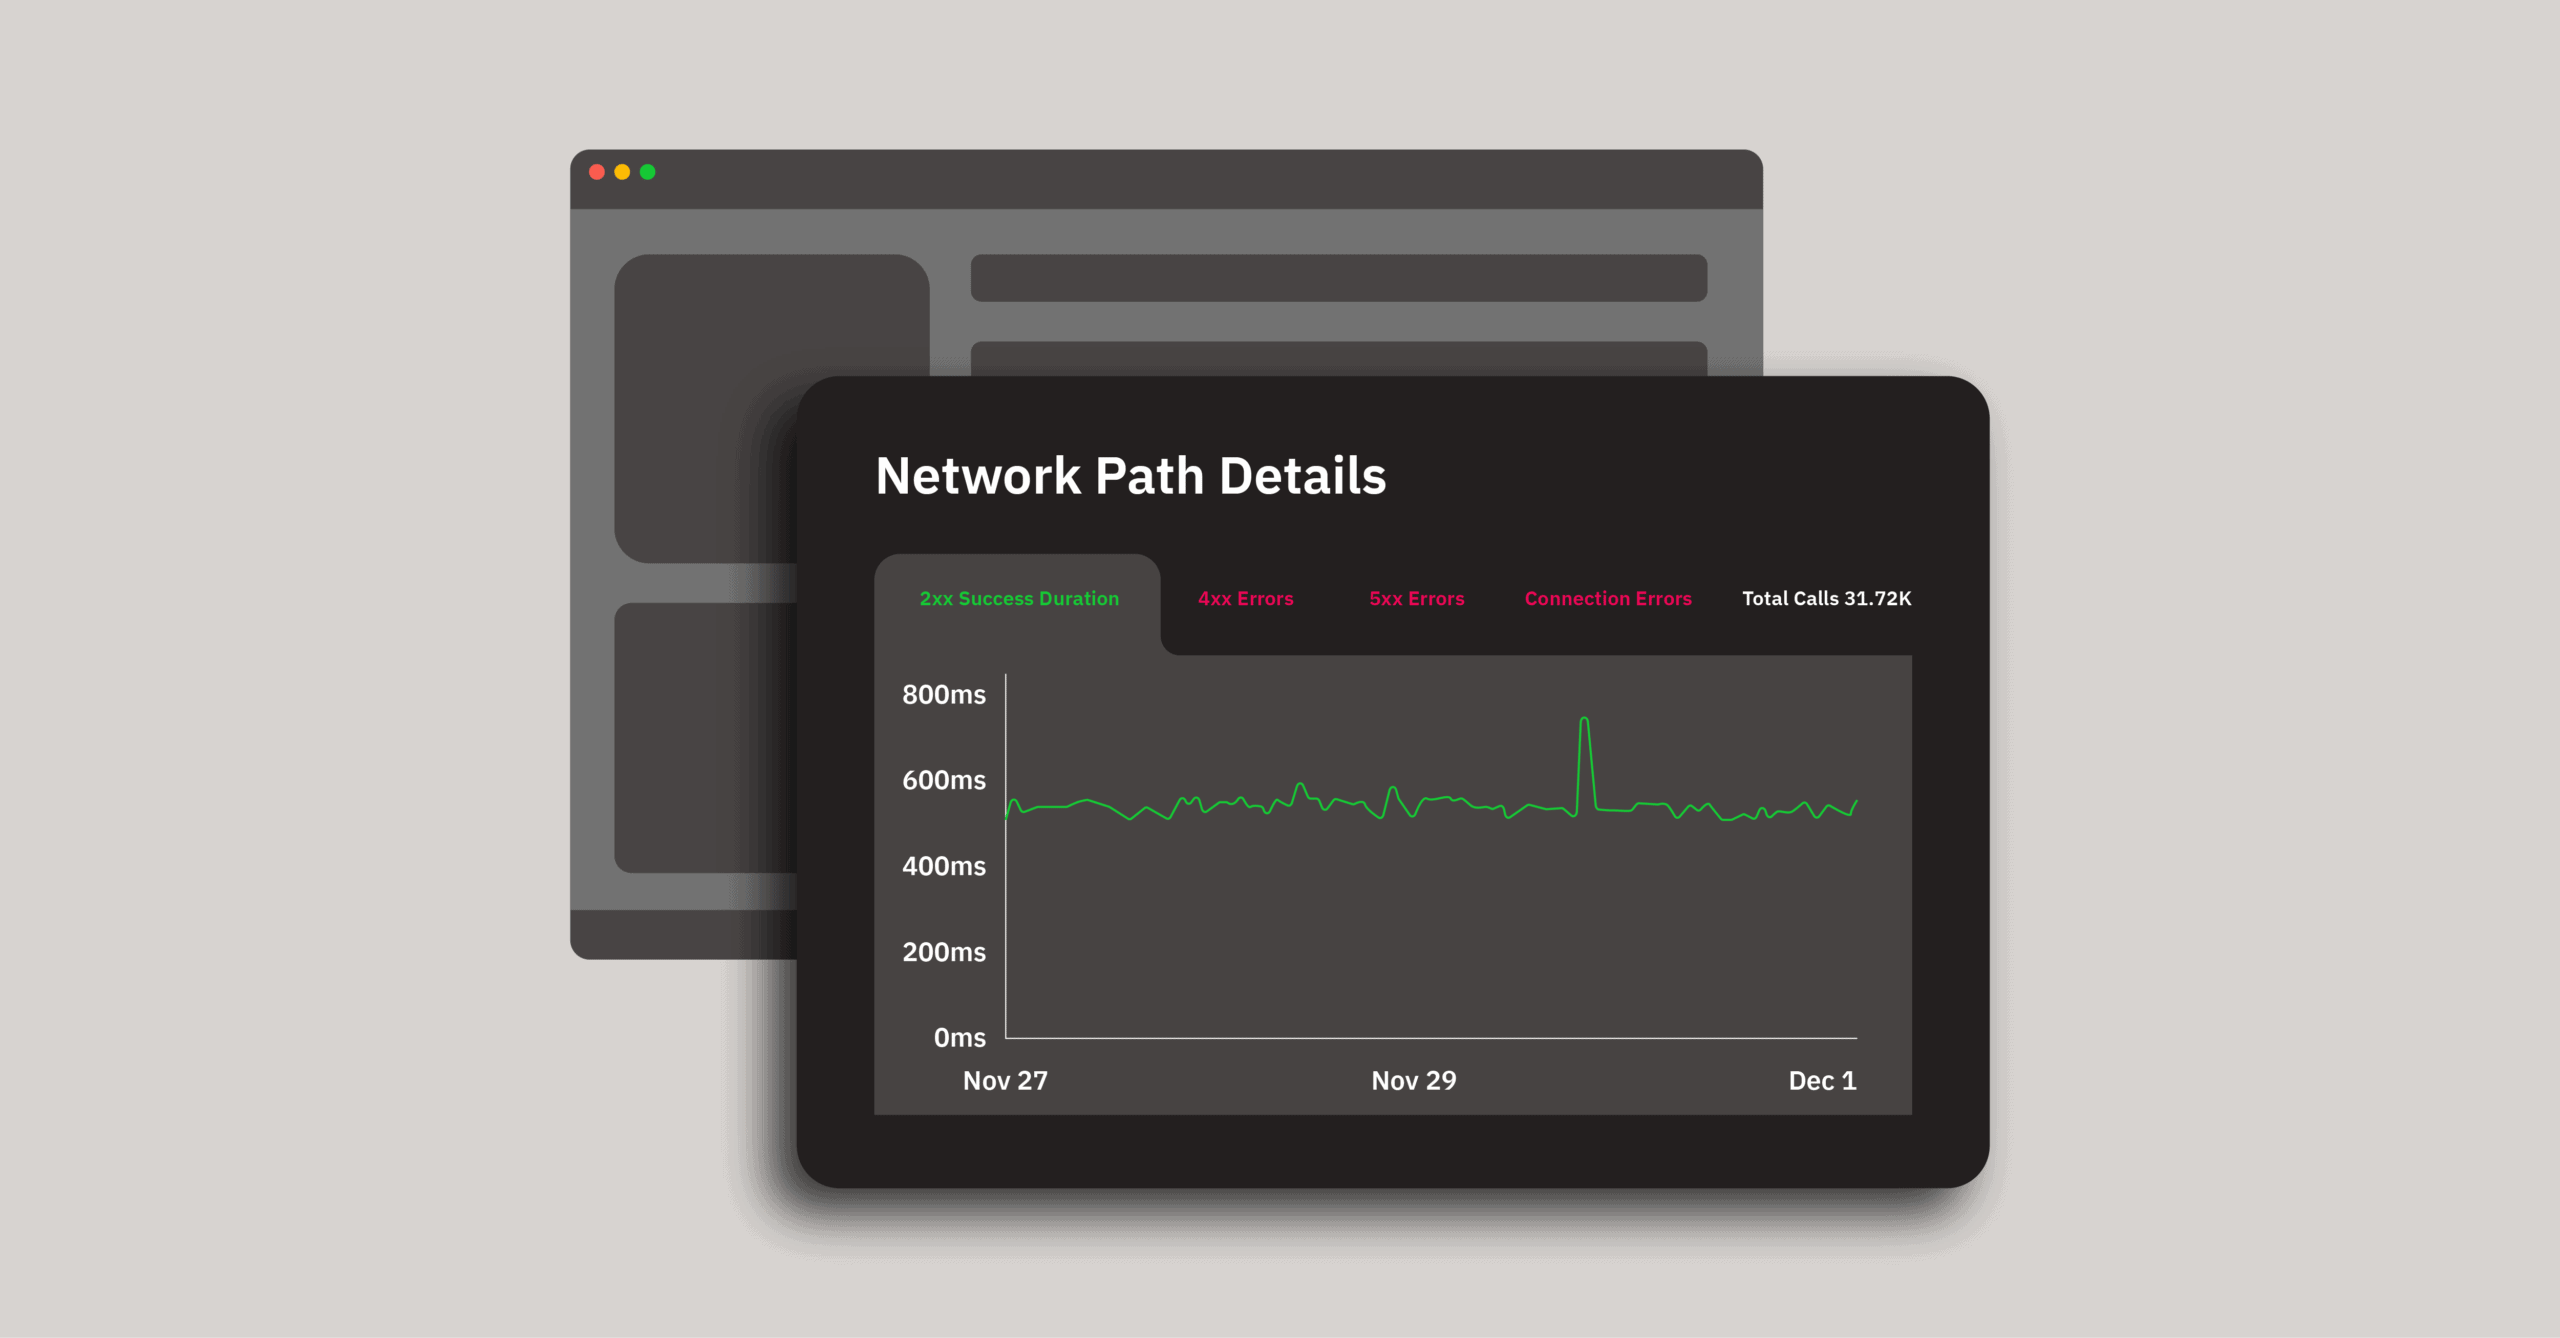
In the Embrace sandbox, we start with a real endpoint from the National Parks API. The network dashboard gives you an instant high-level view:

  • total calls
  • successes
  • failures
  • breakdown by failure type
  • duration patterns

The biggest insight for beginners?

You immediately see failures that backend tools never surface — like connection errors, which are often the majority.

3. Start with connection errors — backend tools never see these

This is the single best place to begin when learning client-side networking.

A connection error means the request never reached the server.
No backend log will ever capture it.

These happen when users:

  • lose signal
  • switch networks
  • go into airplane mode
  • hit DNS/SSL failures
  • connect through flaky proxies or VPNs

This is the first major “aha” moment: backend monitoring cannot help you understand these failures at all.

4. Check for 4xx errors — these are usually mobile-side bugs

Next, dig into 4xx failures — especially 403 forbidden.

These typically come from issues in the app:

  • missing or invalid tokens
  • incorrect request parameters
  • wrong content type
  • formatting mismatches
  • a release that changed how requests get built

This is one of the fastest ways to spot a regression right after shipping a new version.

5. Separate backend failures from everything else

5xx errors matter, but they’re only meaningful when you understand them in context.

The key distinction you learn here:

  • is the server failing?
  • is the app sending a bad request?
  • or are users offline?

Embrace surfaces all three in one view, which removes the guesswork from triage.

(Included within the next combined clip — see Step 6)

6. Look for timeout mismatches — they cause terrible UX

Timeout mismatches are one of the easiest ways to create terrible user experience:

  • mobile timeout = 60 seconds

  • backend timeout = 30 seconds

The result? Your user waits an extra 30 seconds before anything happens.

In the demo, many calls timeout after ~60 seconds — a dead giveaway of a mismatch.

This clip teaches:

  • why long durations matter
  • how retries magnify the issue
  • why backend tools can’t reveal this

7. Use the built-in tabs to isolate failure types

As you get more comfortable, use the built-in tabs to segment:

  • all calls
  • successes
  • 4xx
  • 5xx
  • connection errors

This makes it easier to find patterns by:

  • OS version
  • app version
  • device type
  • network conditions

This step is simple, but essential for flow.

8. Open real user sessions to understand the “why”

This is where client-side monitoring becomes a superpower.

The Session Timeline shows:

  • what the user was doing
  • which screen they were on
  • the exact network call
  • retries
  • duration
  • request + response details
  • bytes sent / received
  • whether the user abandoned the flow

For teams just getting started, this is the moment debugging becomes fast, clear, and contextual.

9. Create alerting that reflects real user experience

To stay proactive (and avoid noise), set alerts based on session impact, not raw error counts.

Good examples:

  • “More than 2% of sessions hit a 400 error”
  • “Connection errors exceed 10% of sessions”
  • “P95 latency exceeds 3 seconds”
  • “Spike in 503s within 5 minutes”

This keeps alerts actionable and tied to actual user experience — not just infrastructure noise.

10. Key tips when getting started

Here’s what matters most as you introduce client-side network monitoring:

  1. Start with what users feel.
    Timeouts, network transitions, and offline scenarios are invisible to backend logs but obvious in the UI.

  2. Tackle failures by category.
    Connection errors → 4xx → 5xx → timeouts.

  3. Use sessions for root cause.
    You debug faster when you can see the full user journey.

  4. Alert on user impact, not infrastructure volume.
    This cuts alert fatigue and surfaces real issues.

Once you get comfortable with these fundamentals, you’ll be able to move into end-to-end tracing, version diffs, and workflow-level monitoring.

Watch the full walkthrough

Want to follow along step by step?

Full video: Getting started with client-side network monitoring

Embrace Deliver incredible mobile experiences with Embrace.

Get started today with 1 million free user sessions.

Get started free
Related Content