Mobile teams use iOS app crash reporting tools to monitor crashes, inspect crash reports, see crash logs, filter and group errors, set up a robust alerts system, replay user sessions, and more. All of these features work together to provide mobile teams with the context needed to solve issues.
The biggest question to ask when evaluating an iOS crash reporting tool is: Will it help identify, prioritize, and solve the issues that matter the most? In other words, can it empower the mobile team to fix the failures that cause churn and lost revenue?
In this post, we’ll go over the best iOS crash reporting tools to help you make the best decision for your mobile team.
What are iOS app crash reporting tools?
iOS crash reporting tools are essential applications and platforms designed to help developers identify, diagnose, and resolve issues within their mobile apps. When an app unexpectedly closes or behaves erratically, it can lead to a poor user experience, potentially causing users to abandon the app altogether. Crash and error reporting tools provide critical insights into the circumstances and causes of such crashes, enabling developers to maintain and enhance app reliability and performance.
Why use software to detect iOS app crashes?
Maintaining your app’s stability is essential for user satisfaction and retention. iOS crash reporting tools help achieve reliable performance by:
Enhancing user experience: Crashes disrupt users, but crash reports automatically offer precise insights, helping developers address issues proactively and improve user satisfaction.
Real-time monitoring and alerts: These tools provide real-time performance monitoring and instant alerts for crashes, enabling swift responses, preventing negative reviews, and maintaining user trust.
Comprehensive diagnostic information: They give detailed data like stack traces and user actions, aiding developers in understanding and resolving crashes quickly.
Issue prioritization: Tools categorize and prioritize crashes by frequency and severity, allowing teams to focus on critical bugs affecting most users.
Continuous improvement: Regularly using crash reports fosters code refinement and app robustness, enhancing development skills and practices.
How to choose the best iOS application crash reporting tool
To find the best iOS crash reporting tool for your team, you need to assess your goals and KPIs. More importantly, ask your mobile team what their blockers and pain points are. Too often we find that mobile teams are forced to use tools that are not purpose-built for mobile. What usually happens is the mobile application suffers as a result.
Remember that, whenever possible, you should limit the number of SDKs in your mobile applications to prevent performance degradations. For example, initializing too many SDKs is a surefire way to bloat your mobile app startup time. You should search for solutions that offer robust functionality in as few SDKs as possible. Not only will that improve app performance, but it will reduce the amount of mental hopscotch your mobile engineers take when jumping between many tools.
Mobile tooling has come a long way in the last few years. There are plenty of wonderful options for measuring, monitoring, and optimizing user experiences. Above all else, the tooling you choose should provide visibility that empowers your team to make the best decisions for your business.
The best iOS crash reporting tools in 2026
Side by side tool comparison
| Tool | Key Feature | Use Case |
| Embrace | Detailed session data and analytics | Monitoring and diagnosing user experiences |
| Firebase Crashlytics | Real-time crash reporting with insights | Tracking and prioritizing crashes |
| Xcode | Integrated development environment with crash logs | Debugging and profiling during app development |
| Visual Studio App Center | Continuous integration and delivery with crash reports | Automating build, test, and distribution processes |
| Raygun | Customizable error grouping and alerting | Detailed diagnostics and performance monitoring |
| Rollbar | Real-time error monitoring with AI grouping | Proactive error resolution and root cause analysis |
| Bugsee | Screen recording and network traffic logs | Visual bug tracking and collaborative debugging |
| Countly | Comprehensive product analytics with crash reports | Analyzing user behavior and retention |
| Flurry Analytics | Event tracking with basic crash reporting | User engagement analytics and segmentation |
| Instabug | In-app feedback and bug reporting with user insights | Enhancing user feedback loops and app testing |
1. Embrace
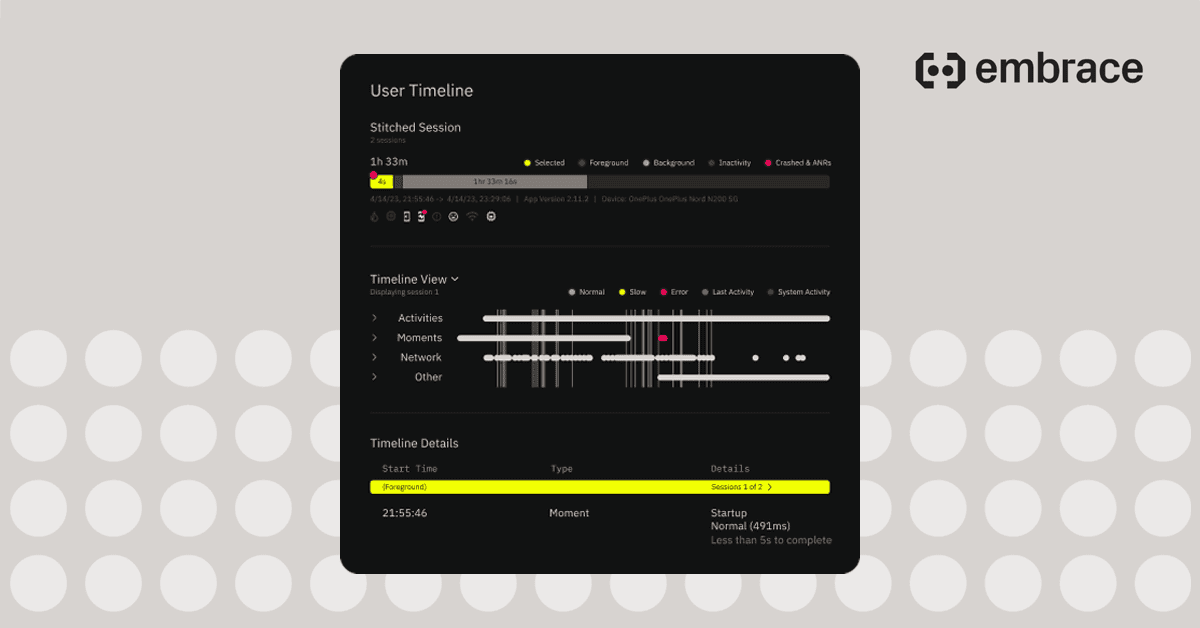
 Embrace is an observability and data platform that provides crash reporting, performance monitoring, and proactive alerting for mobile teams. It is a comprehensive solution that fully reproduces every user experience from every single session. Your team gets the data it needs to proactively identify, prioritize, and solve any issue that’s costing you users or revenue.
Unlike other iOS crash reporting tools, Embrace collects comprehensive data from 100% of user sessions. That means, if there is a crash, you get additional context like the timing and order of all technical and behavioral events:
- Views/activities
- Network calls
- Logs
- Taps
- Low memory warnings
- CPU pegging
- Low power mode
- Connectivity
- And so much more!
Embrace’s user session insights feature allows mobile teams to immediately reproduce issues in production.
No more guesswork or operating from limited information. Instead, mobile engineers spend as little time as possible resolving issues so they can spend more time building features and growing your business.
Even better, with comprehensive data from every single user session, your team can easily prioritize engineering resources based on business impact. See how many users are affected, including the distribution of the issue across devices, OSs, countries, and more. That way, you know ahead of time which issues are even worth fixing.
With Embrace’s proactive alerting system, your mobile team uncovers issues before users complain about them. Efficiently troubleshoot phased rollouts, live events, and cross-release features so you solve issues before they affect your bottom line.
Here are just a few examples of what Embrace’s mobile-first platform can provide to your iOS team:
- Webview thread monitoring with automatic reloading on failures
- Network body capture
- Automatic classification of Auto Layout crashes and CollectionView crashes
- Crash reports for Watchdog Terminations
- Startup time optimization
- Tracking abandonment rates and user terminations during key user flows like checkout and purchase
- And more!
Embrace is so much more than a traditional iOS crash reporting tool. It’s a mobile data platform that powers business decisions through high-fidelity data from 100% of user sessions. Your team can just as easily solve known issues as uncover the unknown ones they don’t even know about… yet.
Embrace’s customers include Wish, GOAT, The New Yorker, Hyatt, Procter & Gamble, and Cameo. We work with the world’s top companies to help them deliver amazing mobile experiences that continuously delight users.
Start a free trial of Embrace today.
2. Firebase Crashlytics

Google knew that mobile is the future, so they acquired Crashlytics in 2017 and integrated it into Firebase as part of their plan to support Android development. The Crashlytics SDK can be integrated into any app and begin to track crashes.
A very attractive part of Firebase Crashlytics is that it is designed to work with the rest of Google’s offerings. For example, a Firebase project (which will easily integrate Crashlytics monitoring) is also a Google Cloud Platform project by default. This means billing, permissions, IDs, and more are shared across the consoles.
Here are a few of the crash reporting features of Firebase Crashlytics:
- Stack traces alongside breadcrumbs, custom properties, and device data
- Filtering by issue state, device, OS, and custom key value pairs
- Setting user identifiers to search for crashes affecting specific users
- Velocity alerts for crashes that exceed a certain percentage of user sessions in a one-hour time period
Unfortunately, Firebase Crashlytics does have latency limits for collecting analytics data. This can result in crash reports being delayed for up to a day. This lack of real-time information can impact a mobile team’s ability to troubleshoot live releases or respond to user complaints efficiently.
Firebase also offers performance monitoring so mobile teams can track metrics like median duration of network requests and custom traces. You can identify regressions by comparing week-over-week changes. Unfortunately, you cannot inspect the performance of network calls within the context of individual user sessions. So Firebase cannot provide much context into issues stemming from slow or failing network calls.
With Firebase Crashlytics, mobile teams can solve 90% of crashes. However, the toughest issues rely on detailed user session context to solve (e.g. device state, connectivity, technical events, and user actions). If mobile teams find themselves continually searching for more visibility, that’s when they should start looking for an iOS crash reporting tool that provides more complete user experience data.
Mobile teams can go a long way with Firebase Crashlytics. It’s a free crash reporting tool that delivers a ton of value for the price point. Here are a few helpful links to Firebase’s other products and their pricing plans.
3. Xcode
Xcode is Apple’s official IDE and it contains crash reporting features for iOS, iPadOS, macOS, tvOS, and watchOS. Xcode provides logging, crash grouping, and crash report deobfuscation.
Xcode is able to collect and generate:
- Crash reports that describe how your app terminated and document the code running on each thread at the time of the crash
- Jetsam event reports which describe the system-memory conditions in which the OS terminated an app
- Device console logs with information on operations that occurred in both the OS and app itself
That’s not to say it doesn’t have shortcomings as a crash reporting tool. The Crashes organizer cannot collect:
- Watchdog events, such as those from slow app launch times
- Invalid code-signature crashes
- Thermal events, where a device overheats because an app uses too much CPU
- Jetsam events, where an app has high memory use
iOS teams that wish to collect these logs have a few options. If they have access to the device where the crash happened, they can transfer crash reports to a Mac for analysis. They can also ask users to manually email them crash reports. For teams that want to move fast in troubleshooting issues or responding to user complaints, Xcode might not be the best option. Ultimately, Xcode is an amazing IDE for developing and testing on iOS. For investigating issues in production, mobile teams will probably want a more robust solution.
4. Visual Studio App Center

Visual Studio App Center is an integrated developer services platform for building, testing, releasing, and monitoring mobile and desktop apps. It supports several platforms, including iOS, Android, macOS, tvOS, React Native, Unity, and Xamarin. In 2017, Microsoft acquired HockeyApp and incorporated several of its features, including crash reporting, into App Center.
The iOS crash reporting functionality is part of App Center Diagnostics and contains several great features:
- Crash and error grouping by similarities, such as reason for the issue and where the issue occurred in the app
- Attaching user IDs to crashes and errors for subsequent lookup
- Including custom key value pairs in error reports
- Full stack trace and the state of all threads that were active when the app crashed
- Tracking the status of crash and error groups by marking them open, closed, or ignored
- Email alerts on new crash groups and daily summaries of top crashes
You can search for specific crash and error reports by building queries with several filters, including user ID, method, class, model, OS version, and exception type. App Center Diagnostics also allows you to filter for issues globally by app version, build number, time range, and status. Team members can attach notes to crash and error groups as part of issue tracking.
App Center has a free tier and paid tiers billed through an Azure subscription. For mobile teams that want visibility into issues beyond crashes, App Center might not be the best bet. It does not currently offer performance or network monitoring, and it has very limited alerting functionality. However, since the App Center SDKs are modular, mobile teams only need to subscribe to the services they actually need.
5. Raygun
Founded in 2004, Raygun is an error monitoring platform with support for most languages and frameworks, including iOS error and performance monitoring. It also provides customizable dashboards so developers can monitor application performance, deployments, and customer experience.
As a crash reporting tool, Raygun can be used to collect the following:
- Full stack traces
- OS and app versions
- Device data
- Geographical region
They also integrate into most software tracking tools. If your mobile team needs a crash reporting tool that also provides real user monitoring and application performance monitoring, Raygun can be a strong contender.
You can check out the docs to learn more about additional features like adding breadcrumbs, filtering on error groups, and adding custom data and tags to error reports.
They offer a free 2-week trial, and you can visit their pricing page for more info.
6. Rollbar

Rollbar, a full-stack error monitoring tool, styles itself as your deployment safety net so your team can fix critical errors faster with a real-time alerting system and AI-assisted workflow. Their SDK integrates into multiple platforms, including iOS.
By utilizing machine-learning, Rollbar’s dashboard intelligently groups errors to reduce noise and surface reliable error signals. As a crash reporting tool, Rollbar collects all the data mobile engineers would want, including:
- Stack traces
- Affected users, browsers, and IP addresses
- Breadcrumbs and custom metadata
- Real-time feed of all errors
Rollbar also has a powerful query language so you can find the exact data you’re looking for. Mobile teams that invest the time into learning it can find errors that occurred between specific deploys, aggregate errors for specific customers, or discover which endpoints have the highest failure rates.
Interested teams can try out Rollbar for free or check out their pricing page to determine what tier works for their needs. Mobile teams can rate limit to control how many occurrences are tracked and analyzed to avoid going over a monthly bill.
7. Bugsee
Bugsee is a bug reporting tool with a twist — it records a video that gets sent along with the normal data for crash and error reports. Whenever your app experiences a crash, Bugsee records video of the user’s last actions, including visual indicators for any taps and touches. This provides some very helpful context when troubleshooting issues.
Bugsee also offers several great error monitoring features, including:
- Crash statistics broken down by device and OS
- Crash callstack containing the states of all threads
- Network traffic data from the affected session
- System console logs
The platform also integrates into several issue trackers, such as Slack, Jira, and Trello.
They have various pricing tiers including a free tier that can be used on up to 5 unique devices. This could be a great option for QA teams looking for a simple way to report bugs either through in-app chat or video recordings.
8. Countly

Countly is an open-source web and mobile analytics platform with crash reporting features. It has a free, self-hosted offering in the Community Edition, but the Enterprise Edition is required to access the majority of their premium plugins. With over 15 SDKs, it offers support for analytics, performance monitoring, marketing, push notifications, A/B testing, monetization, dashboards, and more. For a deep dive into their offerings, you can check out their plugins page.
For the purposes of iOS crash reporting, you’ll want to look into these plugins:
- Crashes and Errors, available to both Enterprise and Community Editions
- Symbolication, available only to Enterprise Editions
- Views, available to both Enterprise and Community Editions
- Slipping Away Users, available to both Enterprise and Community Editions
- Performance Monitoring, available to both Enterprise and Community Editions
Here are some of the features Countly provides for crash reporting:
- Crash segmentation by app version, OS, manufacturer, and device
- Device state at the time of crash (e.g. free RAM size, free disk size, and battery level)
- Full stack traces with custom properties added by developers
- Crash-free users and crash-free sessions
- Crash filtering by their state (e.g. resolved, new, reoccurred, fatal, non-fatal)
Although Countly’s main value proposition is product analytics, mobile teams looking for a crash reporter can try out their free plan to see if it’s a good fit.
9. Flurry Analytics

Flurry, founded in 2005, claims to be the world’s first iOS and Android analytics solution. It was acquired by Yahoo! in 2014. While Flurry Analytics is completely free — which includes their crash reporting tool — the platform monetizes their advertiser and publisher offerings.
Here’s what Flurry offers as a crash reporting solution:
- Crashes, handled exceptions, and error logs
- Real-time dashboards with device crash rate and session crash rate
- Filtering crash data by app version, OS, device, country, and more
- Receiving alerts on crashes and errors directly in the Flurry mobile app
- Automated ticket creation for first-seen crashes
- Historical dashboard for comparing app health over the last year
Flurry can be integrated into Android, iOS, watchOS, tvOS, React Native, and Unity. Because it is a free option, Flurry does not offer many functions out of the box one can expect from higher-fidelity solutions like Embrace. For example, it doesn’t offer full user session context, performance monitoring, advanced crash solving, network monitoring, or highly targeted alerting.
For mobile teams who are looking for a crash reporting tool, Flurry is a worthwhile solution. It unfortunately will not be able to uncover unknown issues that do not result in a log or crash (e.g. slow startup times, frozen screens). However, for small teams looking for an all-in-one tool, Flurry can be used by the marketing, product, and engineering teams.
10. Instabug

Instabug, a mobile error monitoring tool, started in 2014 as a way for companies to beta test their apps. Instabug became popular with app developers due to the ability to start a live conversation with affected users while collecting in-app feedback. Users and testers can provide context through annotated bug reports via screenshots and screen recordings to aid the app developers in determining what went wrong.
In addition to the basic features of a crash reporting tool, Instabug provides the percentage of affected users, number of crashed sessions, and app versions impacted. Particularly interesting is an in-app survey feature that Instabug claims to have double digit response rates.
Their crash reports contain stack traces alongside information about the device environment and network request logs. Instabug offers more context than some crash reporters, but does not offer the same level of visibility that unsampled collection of entire user experiences affords.
Instabug’s Basic Plan comes with Bug Reporting. Crash Reporting and App Performance Monitoring are separate add-ons. You can check out their pricing page to learn more.
How to choose the best iOS crash reporting tool
To find the best iOS crash reporting tool for your team, you need to assess your goals and KPIs. More importantly, ask your mobile team what their blockers and pain points are. Too often we find that mobile teams are forced to use tools that are not purpose-built for mobile. What usually happens is the mobile application suffers as a result.
Remember that, whenever possible, you should limit the number of SDKs in your mobile applications to prevent performance degradations. For example, initializing too many SDKs is a surefire way to bloat your mobile app startup time. You should search for solutions that offer robust functionality in as few SDKs as possible. Not only will that improve app performance, but it will reduce the amount of mental hopscotch your mobile engineers take when jumping between many tools.
Mobile tooling has come a long way in the last few years. There are plenty of wonderful options for measuring, monitoring, and optimizing user experiences. Above all else, the tooling you choose should provide visibility that empowers your team to make the best decisions for your business.
How Embrace helps mobile development teams
Embrace is a data driven toolset to help mobile engineers build a seamless user experience. We are a comprehensive solution that fully reproduces every user experience from every single session. Your team gets the data it needs to proactively identify, prioritize, and solve any issue that’s costing you users or revenue.
Want to see how Embrace can help your team grow your mobile applications with best-in-class tooling and world-class support? Sign up for a free trial today and learn how we help teams set and exceed the KPIs that matter for their business!