App Performance
Learn how Embrace’s User Session Timeline helps you track your entire networking stack, giving your users a better experience in your app.
Embrace’s User Session Timeline lets you proactively track your entire networking stack to ensure users have a seamless experience.
Almost every app today sends some sort of information over a network connection, whether to get users to their photos, place items in their shopping cart, or post a high score to a leaderboard.
But how can you make sure this data is getting to where it’s supposed to go, in order to ensure users have an uninterrupted experience?
Embrace’s User Session Timeline is built, in part, to help mobile developers validate their networking stack in order to address this very problem.


The User Session Timeline is a mobile real user monitoring tool built to help developers visualize, analyze, and investigate every user interaction within their apps.
The User Session Timeline makes it easy to see when users enter your app, tap buttons, or scroll up and down a list. Likewise, it also gives mobile engineers access to vitally important networking information like:
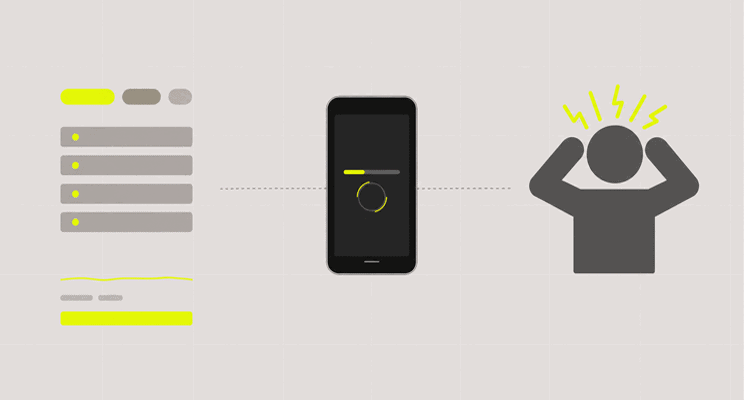
The reason this data is so important is because of the outsized role networking issues play on both user experience and, as a result, churn.
With that in mind, let’s see how the User Session Timeline is designed and how it can help you validate your network stack.
The User Session Timeline offers increasing amounts of information as you look from the top of the screen to the bottom. At the top is the summary of recent sessions for a given device in the Stitched Session view, which we’ll talk more about later.
Below that is the Timeline View, a horizontal visual summary of the significant events of a given user session. Finally, in the Timeline Details section, you’ll see the specifics of each process and interaction within your application.

This is where you’ll see any details for an individual user, and any feedback that your app offers about that user’s journey.
Network requests are conveniently categorized as “Network” type events in the timeline. Out of the box, Embrace’s mobile client SDKs are set to track HTTP/S requests. The networking capture was built with REST in mind, so you’ll see the familiar elements: HTTP method (GET/POST/PUT/DELETE), resource URL, and response code.
Embrace also automagically captures more information about the request, aside from the REST specification.

With these additional details, you’ll see the length of time the request took to complete, when that occurred, and the payload sizes for the request sent, as well as the response received.
You can also categorize the destination for your request.
In the above example, the nps.gov domain is one that the developer does not control. For the app’s backend or other related services controlled by your engineering team, you can designate them as first-party domains for further attention and analysis.

Defining exactly what a session is for a user can be difficult. Imagine a user opened your e-commerce app and started shopping, but then checked a push notification for a text message before hopping back into the app.
It would make sense to describe this flow as one single “experience.” But from the app’s perspective, it was working in the device’s foreground, then the background, and then the foreground again.
How that impacts the user experience can be difficult to ascertain without the data provided by the User Session Timeline. For example, when the app backgrounded, can you tell what, if any, resources were lost? What if requests came through with nothing to update in the UI, would you be able to see that breakdown in the process?
To deal with this scenario, the User Session Timeline has the experience-merging structure of the Stitched Session.

When sessions occur consecutively on a single device, the Embrace dashboard does the work of lining them up for you to review. In the current UI, light blue are the foreground sessions, and in dark blue are the backgrounded sessions where the app is not actively in use, but might still be performing certain processes.
For example, if a GET request was made when the user tapped a button, then we know the app was in the foreground.
However, if that user headed over to check their music app while that request was still in-progress, the app would switch to the background.
As a developer, you need to know whether or not your app succeeded in completing the request. With Embrace’s User Session Timeline, verifying a request completed is as simple as checking the individual session for more details.

Hovering over a single segment in the Stitched Session allows you to see a summary of the details of that session. Tapping the link in the tooltip should bring you to more information in the User Details screen. What were the networking errors here? The screenshot below shows more.

Looks like their request failed. In this case, the root cause of the error wasn’t how your app received data, but rather that the request was unauthorized by the serving API!
The REST paradigm through HTTPS is the most common case for networking that Embrace’s mobile client SDKs test for. However, you might want Embrace to do some deeper work for your mobile application.
Say you were using a WebSocket to stream information continuously from a single HTTP connection to a GraphQL API. This pattern isn’t the same as the REST call-and-response above, but you can still instrument the client SDK to track it. This would be a good scenario for tracing a process from beginning to end.
Using Embrace’s tracing, you can define for yourself the process you wish to observe. Each case might be different, as no single app is the same as another (Apple would simply never allow this), but there is a mental model that you might wish to apply:
Going back to the streaming information example, a WebSocket is a continuously-open HTTP connection to some resource. It will provide the app with some data until the app says to close the connection.
To trace this specific example, or in other words, to see if the WebSocket process succeeded or failed, you should make sure you were able to open the WebSocket connection, able to receive the desired information from the resource, and that you were able to close the WebSocket.
let streamSpan = Embrace
                 .sharedInstance()
                 .createSpanNamed("Opened Streaming Websocket")

let receiveStreamDataSpan = Embrace
                            .sharedInstance()
                            .createSpanNamed(
                            "Began Streaming Information Inside Websocket Span",
                            parent: streamSpan
                            )

// open your WebSocket
streamSpan.start()

// started received information
receiveStreamDataSpan.start()

// stopped receiving information
receiveStreamDataSpan.stop()
streamSpan.stop()
Once you’ve instrumented the connection in the way you like on the mobile client, you’ll start to see it in the dashboard.

The Timeline Details has summary information on the duration of a trace and the developer-defined name. This trace is named “Opened Streaming Websocket” by the client iOS application. Clicking into it will show more details about the units of work that occurred.

For the individual trace, you’re able to see the duration of the WebSocket connection, and the time period that information was actually being received while the WebSocket was open.
This instrumentation from the mobile SDK side is flexible enough to be defined in exactly the way you need. So, in the future, some optimizations for our trace might be to preserve resources, to ensure that the WebSocket was successfully closed, and to measure the payload of the data received. There is always space to iterate!
Embrace’s User Session Timeline can help you prevent networking issues before they get out of hand.
By providing this vital data, mobile engineers can proactively address networking issues before they impact their wider user base, and can begin to make optimizing app performance a part of their daily workflows.
Learn how Embrace can help you improve network and overall app performance by requesting a demo today.
Check out our self-guided demo that shows you how to identify issues using Embrace's User Timeline.
See the demo