This piece was originally published on The New Stack.
OpenTelemetry (OTel) is an open source observability framework designed to capture and export telemetry data from applications to understand their internal state. It generates signals that can be analyzed in various OTel-compatible observability systems. The three fundamental types of data collected are traces, metrics, and logs.
- Traces describe how an operation travels end-to-end through your distributed services. They consist of spans, with each span recording the time taken by each process. Spans can have attributes and events.
- Metrics measure your system’s availability and performance over a period of time.
- Logs are time-stamped text records that can be structured, or unstructured, and include metadata.
Why Should You Care?

Building web applications is exciting, but it’s all for naught if users aren’t engaging with your new features, or if the application is built in such a way that they can’t engage with your features. Whether you’re aiming to deliver the best user experience or assessing the impact of new changes, you often need to answer common questions:
- How long does it take for this page to load?
- How many users are clicking this button successfully?
- Where are users dropping off?
Tracking and measuring this information is crucial for understanding why your product is or isn’t working.
Many companies, from small startups to large enterprises, offer production-ready solutions for this issue, providing developers with tools to instrument their apps and easily analyze collected data through dashboards and graphs.
So, why should you care about OpenTelemetry?
Full-stack observability
Even if your users interact exclusively with your client application, their experience depends not only on your website functioning correctly but also on the underlying services that support each operation. A page can be slow to load for various reasons, such as a large JavaScript bundle, a busy server or a poorly written query.
Most tools allow exporting user data through an API or directly to a database or data lake. However, this means that you or your backend team will need to integrate that data (in its specific format) into your pipeline before you can correlate it with the rest of your stack. By using the OpenTelemetry standard, you enable everyone in the company to integrate with your client-side metrics, utilizing existing tools like Tempo, Loki, and Prometheus, and analyze user data end-to-end.
Avoid vendor lock-in
OpenTelemetry is vendor- and tool-agnostic, and provides a common language for systems to speak with each other. There are multiple free and commercial solutions available for collecting and viewing your data, so you can choose the one that best fits your business needs. If a tool isn’t working out, you can switch to another without having to change how you instrumented your applications.
You can run everything yourself, and the standards and protocols are community-driven.
Auto-instrumentation
As OpenTelemetry becomes the community standard, more tools and frameworks are being instrumented to work out of the box with minimal code changes.
Instrumenting a React app
I’ve instrumented a small app that communicates with a Go API and a PostgreSQL database. Each part of the stack emits telemetry data — most of it auto-instrumented; I’ll cover web auto-instrumentation later.
Let’s get started. If you’d prefer to dive directly into the code, feel free to check out the GitHub repository.
First, you need a place to send and view your data. This usually begins with the OpenTelemetry Collector, which receives data and forwards it to various backends like Prometheus or Tempo. Fortunately, Grafana provides an OTel-ready backend in a Docker image called grafana/otel-lgtm that runs the collector alongside Loki, Grafana, Tempo and Mimir to collect and view all your data.
Set Up Basic Instrumentation
To start communicating with the collector, start by installing the necessary libraries. To add tracing and metrics to your app, include @opentelemetry/api
, @opentelemetry/sdk-metrics
and @opentelemetry/sdk-trace-web
. Additionally, @opentelemetry/exporter-metrics-otlp-http
and @opentelemetry/exporter-trace-otlp-http
are required to send data to the exporter via HTTP.
npm install --save @opentelemetry/api @opentelemetry/sdk-metrics
@opentelemetry/sdk-trace-web
@opentelemetry/exporter-metrics-otlp-http
@opentelemetry/exporter-trace-otlp-http
or
yarn add --save @opentelemetry/api @opentelemetry/sdk-metrics
@opentelemetry/sdk-trace-web
@opentelemetry/exporter-metrics-otlp-http
@opentelemetry/exporter-trace-otlp-http
Next, create a Tracer Provider, which is necessary for creating tracers:
const tracerProvider = new WebTracerProvider({
resource: resource,
});
Then create a Span Exporter. Here, I’ll use OTLPTraceExporter
since I’m sending spans over HTTP. Make sure you use the correct URL for your OTel collector:
const traceExporter = new OTLPTraceExporter({
url: "<http://localhost:7070/v1/traces>",
headers: {},
});
Next, create a span processor. Using SimpleSpanProcessor
, spans are sent immediately after they end:
const spanProcessor = new SimpleSpanProcessor(traceExporter);
Finally, tie everything together by adding the span processor to the Tracer Provider, registering it and setting it as the global Tracer Provider. This setup allows you to obtain a tracer anywhere in your app using the OTel API:
tracerProvider.addSpanProcessor(spanProcessor);
tracerProvider.register();
trace.setGlobalTracerProvider(tracerProvider);
Configuring metrics is a similar process, as exporting any OTel signal requires, at minimum, both a signal provider and a signal exporter:
const metricExporter = new OTLPMetricExporter({
url: "<http://localhost:7070/v1/metrics>",
headers: {},
});
// Like the SpanProcessor, the metric reader sends metrics to the exporter
const metricReader = new PeriodicExportingMetricReader({
exporter: metricExporter,
// Default is 60000ms (60 seconds). Set to 10 seconds for demonstration purposes.
exportIntervalMillis: 10000,
});
const meterProvider = new MeterProvider({
resource: resource,
readers: [metricReader],
});
metrics.setGlobalMeterProvider(meterProvider);
You can find the complete file in the GitHub repository.
Run all this code at the start of your app, and you’re ready to start instrumenting your website.
Configure auto-instrumentation
Some packages provide auto-instrumentation of useful information out of the box. It’s worth noting that if you use one of these packages but your app isn’t integrated to send any telemetry, the operations remain NoOp — meaning they don’t add any overhead if you don’t use OTel.
For this demo app, add @opentelemetry/instrumentation-fetch
and @opentelemetry/instrumentation-document-load
:
npm install --save @opentelemetry/instrumentation-fetch
@opentelemetry/instrumentation-document-load
or
yarn add --save @opentelemetry/instrumentation-fetch
@opentelemetry/instrumentation-document-load
Then, add this configuration as early as possible in your app life cycle — ideally, even before React starts:
registerInstrumentations({
instrumentations: [
new FetchInstrumentation({
propagateTraceHeaderCorsUrls: [
new RegExp(/http:\\/\\/localhost:8080\\/.*/),
],
}),
new DocumentLoadInstrumentation(),
],
});
Both FetchInstrumentation
and DocumentLoadInstrumentation
offer different configurations. It’s crucial to set up propagateTraceHeaderCorsUrls
, which adds the Traceparent
header to every request made using Fetch. The header allows the request to propagate the parent span’s context to other services, which you can read more about in the OpenTelemetry documentation. You can also see this in action in the next section.
Add spans and metrics
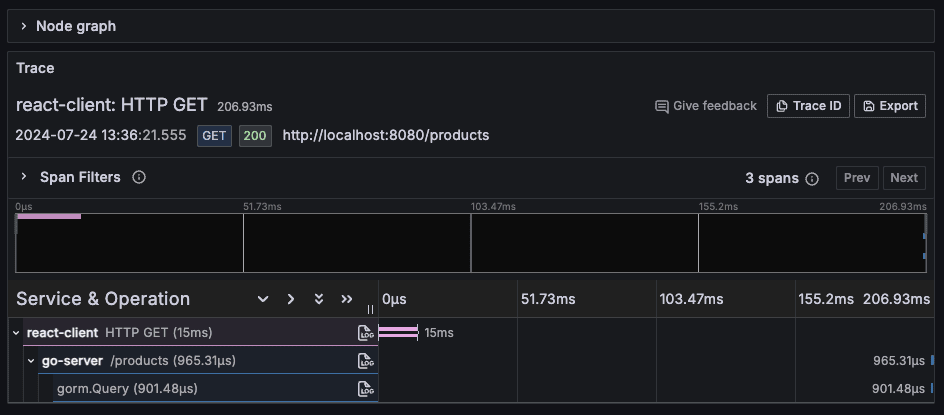
Now let’s see how everything fits together. Every request made using the Fetch method will create a trace. By propagating context through headers, these traces will include spans created by the API as child spans. Note below how this ties together traces from different services:
This transparency is a major advantage of using OpenTelemetry across your stack. It improves communication and understanding of issues across services. While this example is simple, real-life API calls will involve many systems, and may also involve multiple subcalls or queries. It’s more effective to start a conversation with your backend team by saying, “Can you review this query that’s slowing down this API call?” rather than just, “Hey, this API call is slow.”
Adding a customer trace
To create a span using a tracer:
const tracer = trace.getTracer("react-client");
const span = tracer.startSpan("Span Name");
You can add attributes, events or even child spans to this span and propagate it across your app.
One way to manage spans is by using a React context to store and propagate spans through the component tree:
const SpansProvider: FC<PropsWithChildren> = ({ children }) => {
const spansRef = useRef<Map<SpanName, Span>>(new Map());
const getOrCreateSpan = useCallback(
(name: SpanName, options?: SpanOptions): [Span, boolean] => {
if (spansRef.current.has(name)) {
return [spansRef.current.get(name)!, false];
}
const tracer = trace.getTracer("react-client");
const span = tracer.startSpan(name, options);
spansRef.current.set(name, span);
return [span, true];
},
[],
);
const endSpan = useCallback((name: SpanName) => {
const span = spansRef.current.get(name);
if (span) {
span.end();
spansRef.current.delete(name);
}
}, []);
return (
<SpansContext.Provider
value={{ getOrCreateSpan, endSpan }}
>
{children}
</SpansContext.Provider>
);
};
export default SpansProvider;
Later, you could instrument your user flows:
// Home.tsx
...
const { getOrCreateSpan, endSpan } = useSpansContext();
const [purchaseFlowSpan, purchaseFlowSpanCreated] = getOrCreateSpan("Purchase Flow");
useEffect(() => {
if (purchaseFlowSpanCreated) {
purchaseFlowSpan.addEvent("Home Page Visited");
purchaseFlowSpan.setAttribute("user_id", 123);
}
}, [purchaseFlowSpan, purchaseFlowSpanCreated]);
...
// ProductDetails.tsx
...
const { getOrCreateSpan, endSpan } = useSpansContext();
const handleBuyClicked = useCallback(() => {
const [activeSpan] = getOrCreateSpan("Purchase Flow");
activeSpan.addEvent("Buy Button Clicked", {
product_id: productId,
});
activeSpan.setStatus({ code: SpanStatusCode.OK });
endSpan("Purchase Flow");
}, [productId, getOrCreateSpan]);
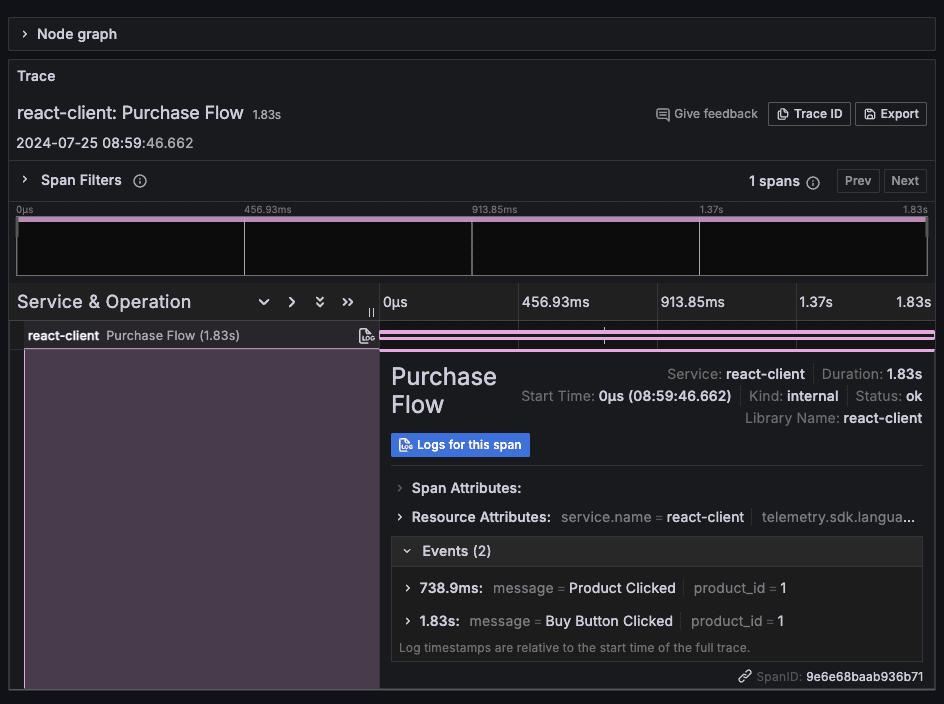
This setup can be visualized in Tempo:
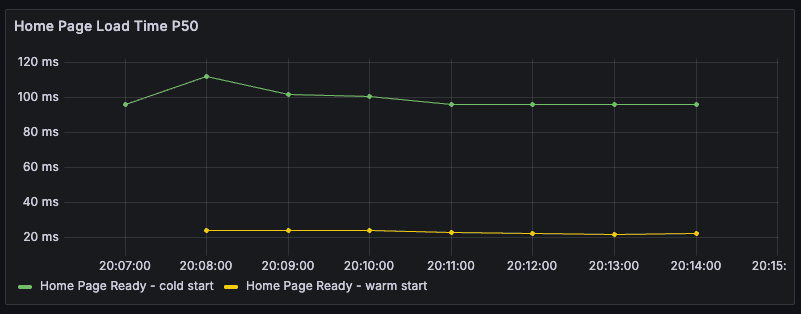
You could generate metrics from these spans to measure how long it takes for a page to fully load (including network requests):
Adding a custom metric
To add a custom metric, obtain a meter and then choose from various types of metrics, such as:
- Counters: Metrics that can only increase or reset in value.
- Gauges: Metrics that can increase or decrease in value.
- Histograms: Complex metrics that are calculated from bucket values.
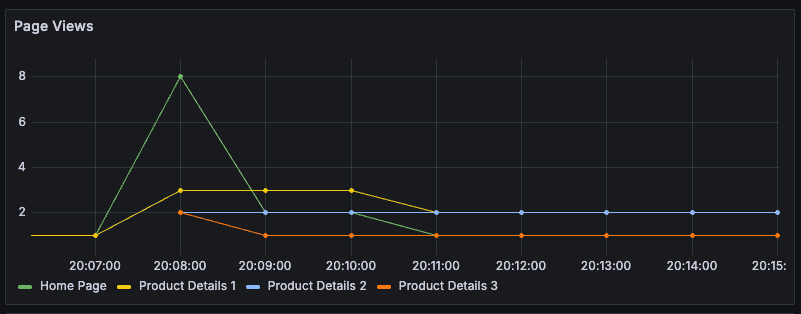
For example, to count how many users visit a specific page, you could create a new hook:
const useTrackPageView = (
pageName: string,
extraAttributes: Attributes = {},
) => {
useEffect(() => {
const meter = metrics.getMeter("react-client");
const counter = meter.createCounter("react_client_page_view", {
description: "Number of views for a page",
unit: "unit",
});
counter.add(1, {
'react_client.page_name': pageName,
...extraAttributes,
});
// Ensure this runs only once
// eslint-disable-next-line react-hooks/exhaustive-deps
}, []);
};
This can be visualized in a graph in Grafana:
Challenges of using OpenTelemetry with React
Although OpenTelemetry was initially designed with backend applications in mind, it can be adapted for frontend use. Core concepts such as telemetry standardization, semantic conventions, and a community ecosystem are very useful for frontend observability, which tends to work across many systems.
The challenge lies in adapting these concepts for frontend observability, particularly with React, where components are frequently mounted, unmounted, and re-rendered for various reasons. Tracing user interactions, which can occur in many different ways and orders, is more complex than tracing requests or scheduled jobs with clear start and end points.
Currently, the Embrace software development kit (SDK) teams are developing new conventions and standards to better support mobile applications. Most of the additions are applicable to web apps as well, since they seek to trace and measure user experiences. Greater adoption will drive community contributions, helping new developers begin instrumenting their code. Will you be an early adopter and help OpenTelemetry become a standard in the frontend world?
If you’re curious to learn more about mobile observability built on OpenTelemetry, check out our open source repos or join our Slack community.
Learn how industry professionals are adopting OpenTelemetry for mobile and weaving it into their bigger-picture observability strategies.
Get the report