Application Not Responding (ANR) errors are a common occurrence on Android when the main thread of an app exceeds a 5-second load time. Unlike crashes that abruptly end the app, ANRs lead to a frozen screen, pausing the app experience and requiring manual force quitting, often resulting in a frustrating user experience
Beyond the frustration it brings, ANRs have far-reaching implications for your business. By reducing ANR rates, you can improve user satisfaction and engagement which earns favor with the Google Play Console. In fact, apps providing smooth, responsive experiences are rewarded with higher rankings and more features on the Google Play Store, enhancing discoverability and fostering organic growth for your Android app.
Since the introduction of Embrace’s ANR Reporting solution, our dedication has been to provide our customers with more accurate and efficient ways to detect, prioritize and resolve ANRs so Android engineers can spend more time building remarkable app experiences.
Solutions today require engineers to waste time sorting through thousands of stack traces in an attempt to prioritize ANRs which can be incredibly time-consuming and make it challenging to pinpoint which require immediate attention.
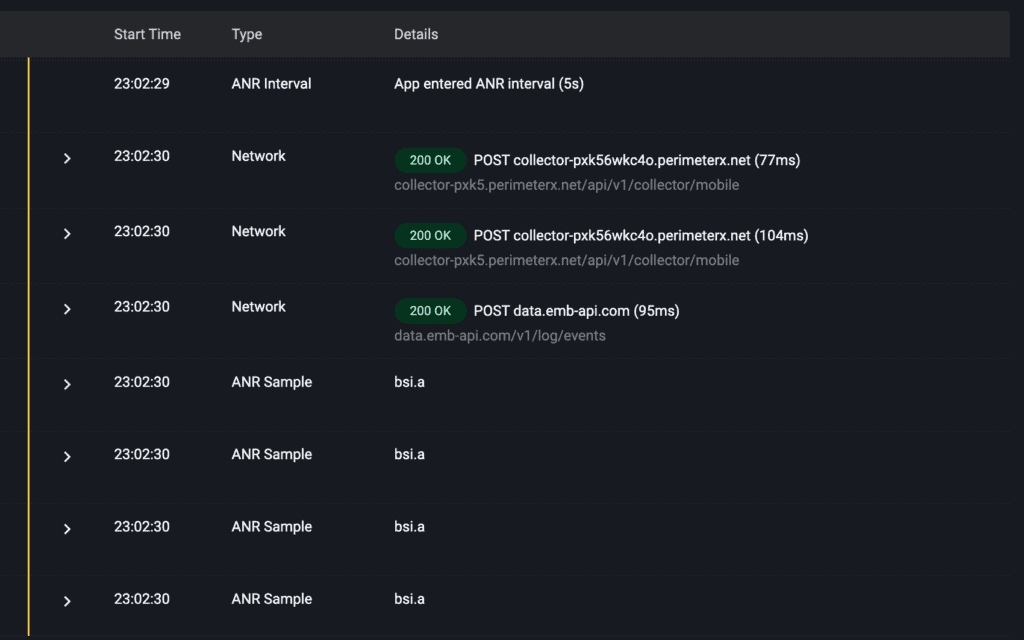
Existing solutions also make it hard to get the full picture of everything that led to an ANR. In most cases ANRs can trigger from multiple factors, so a delayed stack trace may not be enough information to accurately identify all root causes. Factors like poor network connectivity, low battery levels, and/or heavy view rendering, can all contribute to an ANR. Without this additional context, engineers may find themselves trapped in a repetitive cycle of addressing the same ANR and wasting valuable time and resources.
To address these challenges, our approach goes beyond traditional ANR diagnostics. The Embrace Android SDK enables you to collect the right data at the right time and correlate that with user metadata and app interactions to allow more effective detection, prioritization and resolution of ANRs.
In this post, we’ll discuss how you can use Embrace to:
- Accurately detect ANR stack traces with superior data capture
- Filter out noisy ANRs with intelligent grouping and flame graph visualizations
- Understand exactly what factors contributed to the ANR with complete out-of-the-box user session context
- Identify patterns and trends in real-time with a high level-view ANR overview
Accurately detect ANR stack traces with superior data capture
When it comes to capturing ANR sample stack traces, the Google Play Console and other point solutions only show a portion of the picture by capturing a stack trace 5 seconds after the ANR has occurred. This means you’re seeing sample stack traces long after the ANR was triggered which can lead to incorrect diagnosis. The sampling for the Google Play Console may even be delayed beyond 5 seconds due to the load on the device during the ANR, which means you may be missing valuable ANR stack trace data. Lastly, this method only captures data for fatal ANRs and neglects non-fatal ANRs, which are equally vital for enhancing your user’s experience.
To accurately triage and resolve ANRs for good, it’s important to understand what code was running from the moment the ANR is triggered to the end of the ANR interval. With Embrace intelligent ANR Reporting, teams can now auto-capture and surface a stack trace as soon as the main thread is blocked for 1 second, followed by auto-collecting main thread stack traces every 100ms until the app recovers, force quits, or the ANR dialog appears. By capturing these additional stack traces engineers can gain deep insights into the code execution and its evolution throughout the ANR interval to get to the true root cause, all without introducing any unnecessary overhead. This level of detail empowers engineers to quickly spot and resolve both fatal and non-fatal ANRs and ultimately drive better user experiences.
Filter out noisy ANRs with intelligent grouping and flame graph visualizations
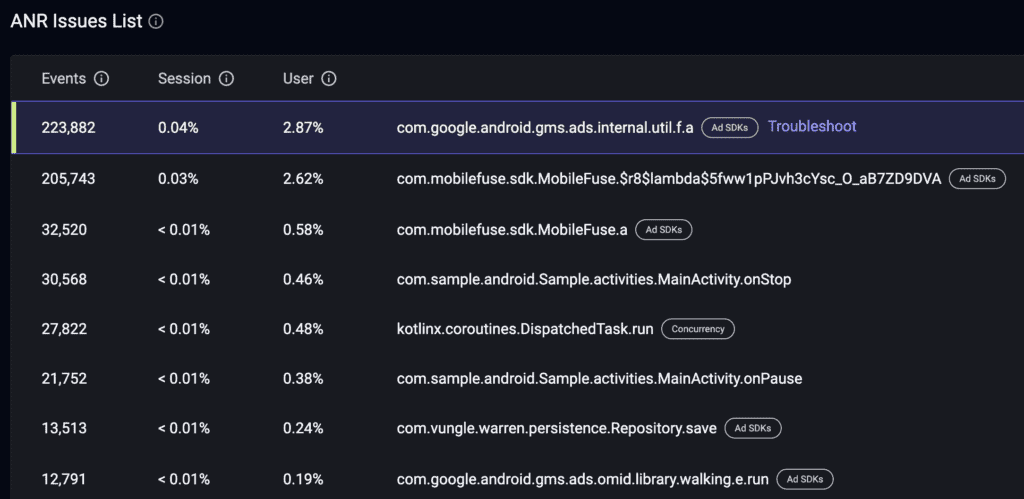
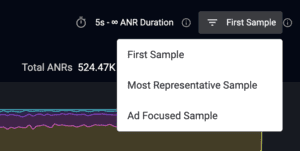
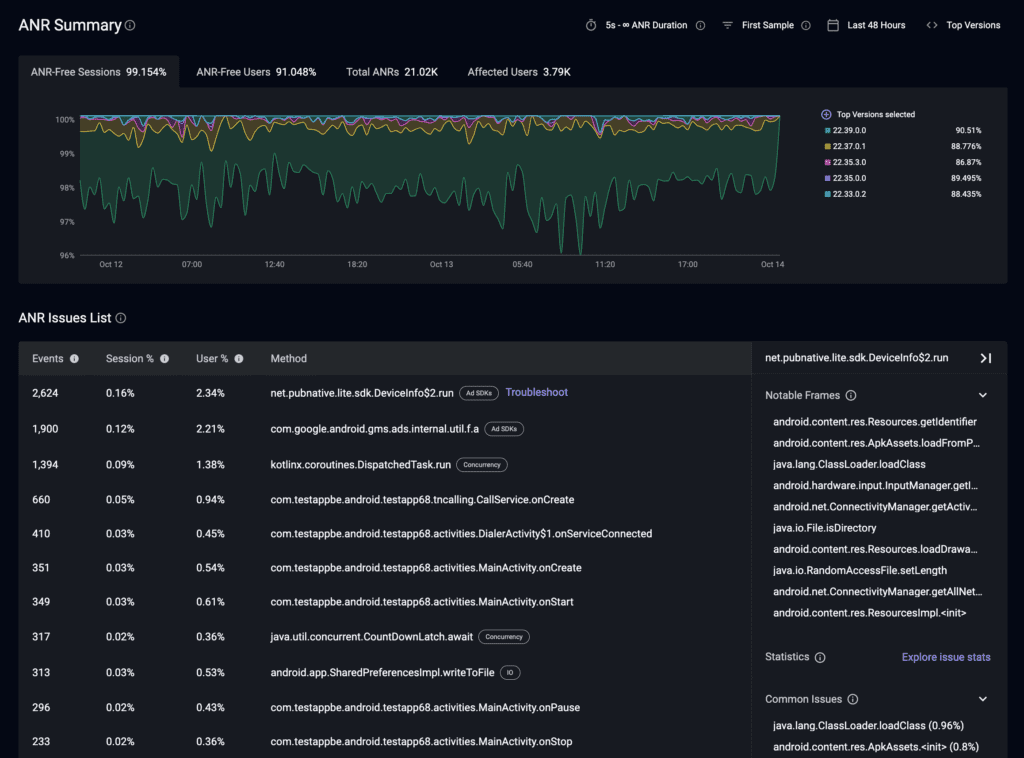
Finding which stack traces to focus on can also be challenging when you’re basing your decision solely on the final stack trace. Oftentimes, the stack traces exhibit enough differences that identifying the root cause becomes challenging. Because Embrace auto-collect’s stack traces throughout the entire ANR interval, teams gain access to a broader range of stack trace samples, providing deeper insights into the underlying cause. Teams can filter sample stack traces by ‘Most Representative’, ‘First Sample’ or ‘AD SDK’ to help visualize the data in different ways and quickly surface the right ANRs. When selecting ‘Most Representative’ Embrace will scan and analyze sample stack traces for you and group them by the most relevant method to identify the code sections likely contributing to the ANR. Embrace, then ranks them by volume, sessions impacted, or users impacted and maps issues to a category (Ads or Concurrency) to help you cut out the noise and focus on what matters most for you and your team.
We also give you the flexibility to group ANRs by the First Sample (where the ANR started), and based on Ad SDK samples allowing you to prioritize resolution efforts with more data that would be impossible with just the final stack trace. If you identify an Ad SDK may be causing issues we make it easy to share your problematic stack trace directly with the third party Ad provider with more partner integrations to come.
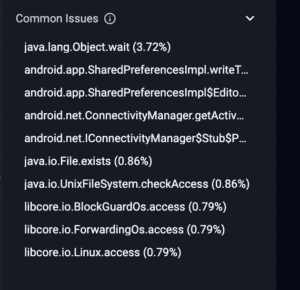
Once you select the type of stack trace samples to focus on, Embrace intelligently surfaces common methods known to cause ANRs across mobile applications. Under Common Issue, you can find our real-time database of thousands of known problematic methods and insights collected from our community of customers and industry known issues to help you surface problematic methods known to contribute to ANRs.
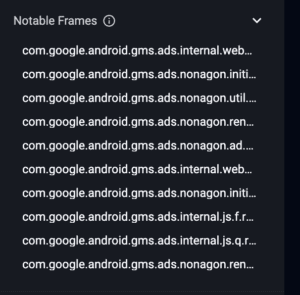
You can also dive into Notable Frames for a specific method to access and inspect all the significant branches across different ANR stack trace samples in a hierarchical view. This feature in addition to our flame graph helps you examine each method in more detail.
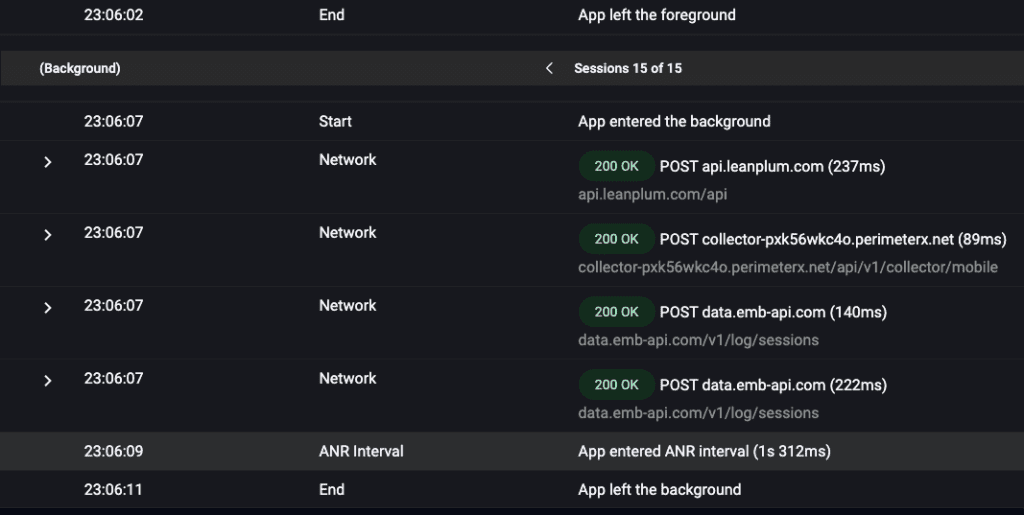
With our Sample Sessions view, you can dive into a list of user sessions that were affected by ANRs that experienced the selected issue. You can pivot seamlessly to any affected user session to dive into every technical and behavioral detail leading up to the ANR to understand exactly what happened.
Using Method Statistics you can view how issues are distributed across different dimensions, like OS version and device, and compare to baseline sessions. This helps you hone in on user segments that matter for your analysis.
Powerful flame graphs that let you drill down to the line of code
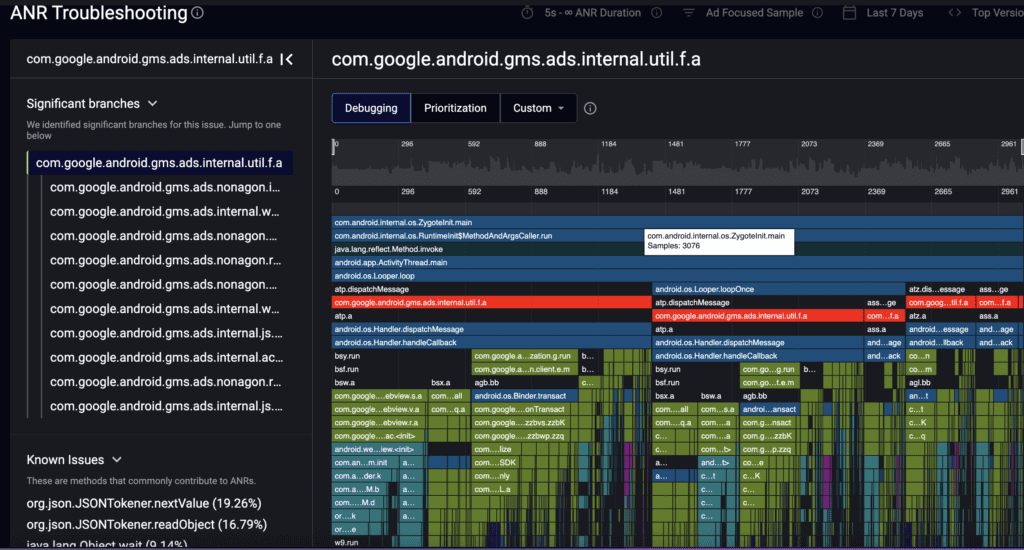
Even with advanced grouping it may still be overwhelming to sift through stack traces. Using flame graph visualizations, we make it easy to surface critical stack traces that contain known problematic methods. Using the flame graph each span represents the number of sample stack traces. The length of the span represents how many sample stack traces the method appears in. The wider and deeper the span, the more likely the code path contributed to an ANR. Simply select a method (shown in red) to pinpoint which 1st or 3rd party code may have contributed to the ANR.
You can select different views to visualize the data depending on your needs:
- Debugging view: Our default view that gives every package and method in the sample stack traces to give you the full picture across sample stack traces.
- Prioritization view: This view allows you to hone in on important and relevant methods/packages that are commonly known to cause issues. Others methods and packages like operating system packages will be collapsed and grayed out to help you troubleshoot faster.
- Custom view: Customize how you want to collapse and filter categories on the flame graph
Selecting a method will take you to the ANR Method Troubleshooting graph. This allows you to see all the code paths that lead to the selected problematic method ( “callers”) and the code paths following the method (“callees”) to help you nail down the line of code that may be contributing to the ANR.

