NEW: Embrace enhances user-focused observability platform with new Web RUM product

Learn more
Web

Introducing Embrace Web RUM: User-focused observability is now available across web and mobile

Embrace is extending our user-focused observability platform to support websites and web apps. With our new Web RUM launch, we're giving frontend teams full visibility into how their end users experience their products – regardless of the screen they're using.

We’re excited to announce a major expansion to the Embrace platform: the launch of Real User Monitoring (RUM) for Web. Powered by OpenTelemetry, this new product extends the granular data collection of Embrace’s SDKs and robust analytical capabilities of the Embrace dashboard to websites and web apps.  

In this post, we’ll cover how Embrace Web RUM solves a challenge faced by our customers, and by engineering teams across industries: the ability to truly understand how end users experience their applications, regardless of the screen. 

What’s missing from current RUM solutions

Traditionally, measuring website and web app performance offered a couple of options, each with their own limitations. 

On the one hand, there are tools built specifically for web developers to gauge their site’s performance. These typically use proprietary data models, collect limited types of telemetry like exceptions and errors, and don’t integrate well into broader observability systems. 

These tools are good for getting a basic sense of site speed and responsiveness and for solving known problems. But they aren’t designed for comprehensive observability or understanding the truly “unknown unknowns” in production. 

On the other hand, there are web-specific tools built by backend observability vendors. While these integrate into the vendor’s solution for “end-to-end” visibility, they are limited for other reasons. Not built by – or tailored to – frontend experts, they typically collect fewer data types and default to classic, backend-style metrics dashboards or log management views. This does not help developers understand or solve the complex, nuanced issues that happen on the client side. 

What’s needed is twofold: 

  1. Capturing the true complexity of the frontend by analyzing your real end user experiences 
  2. Connecting the dots on performance across your software’s architecture using standardized data that’s shared by frontend and backend teams

Let’s dive into how Embrace Web RUM addresses both of these needs. 

Investigate frontend issues with precision

Embrace Web RUM brings user-focused observability to websites and web apps. Rather than drowning in dashboards, developers get actionable insights into what their end users are experiencing so that they can optimize their web apps accordingly. Plus, reliability teams get an easy way to receive frontend data into their backend systems using the same standard and schema – so they can quickly understand the relationship between issues popping up in different places across the stack. 

This ultimately helps everyone – web devs, platform engineering teams, DevOps, and ultimately leadership – prioritize issues that impact real people and revenue.

JavaScript exception reporting

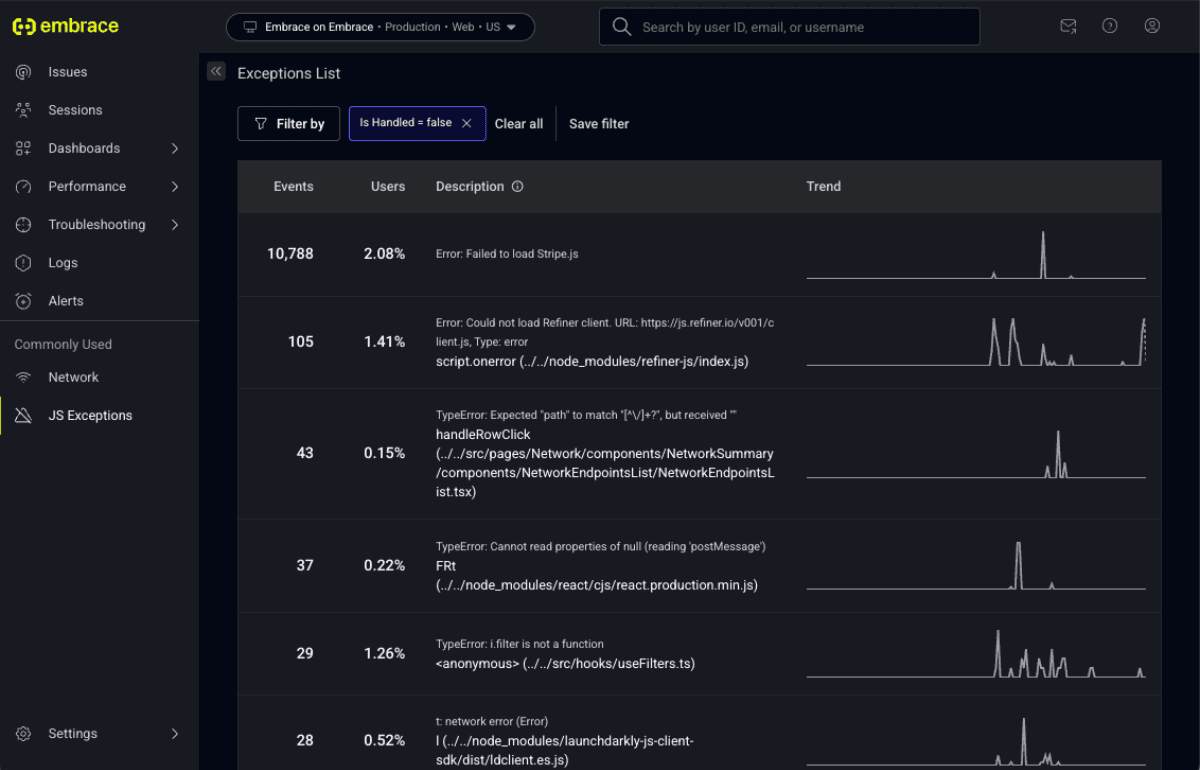
Embrace’s Web SDK catches unhandled JavaScript exceptions automatically and allows devs to report handled exceptions manually in order to investigate non-fatal issues – like rendering problems, missing data from search results, or unresponsive buttons. 

All captured exceptions are visualized in the Embrace dashboard, both at an aggregate level for immediate trend-spotting, as well as at an instance level for deeper troubleshooting. 

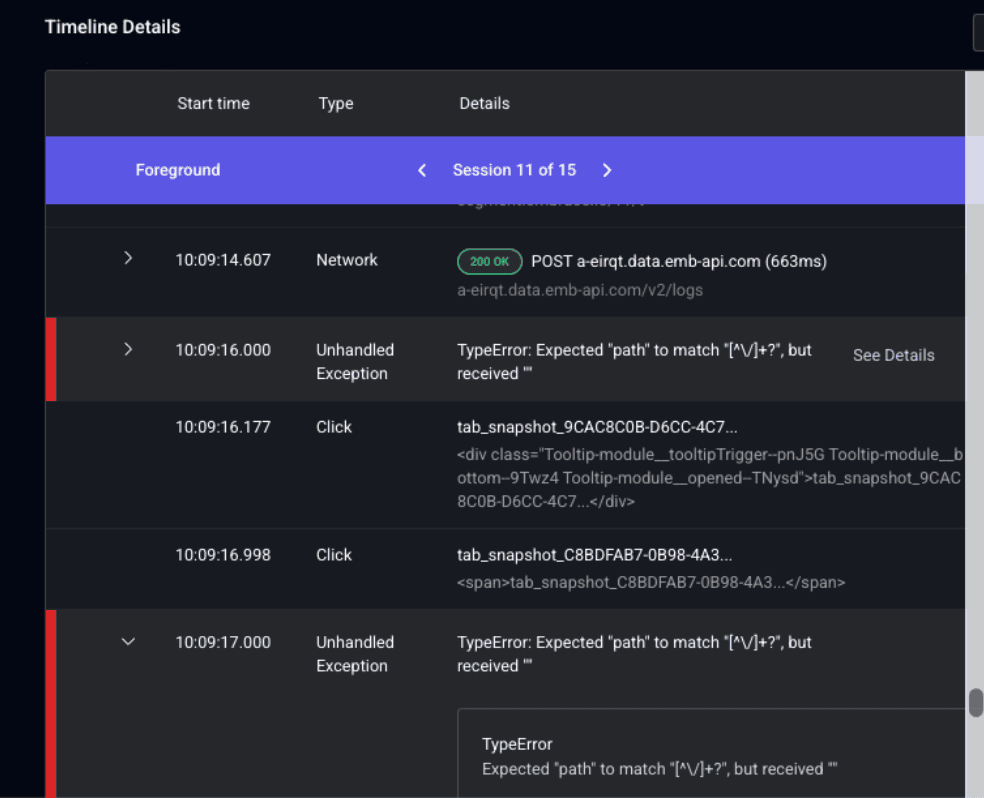
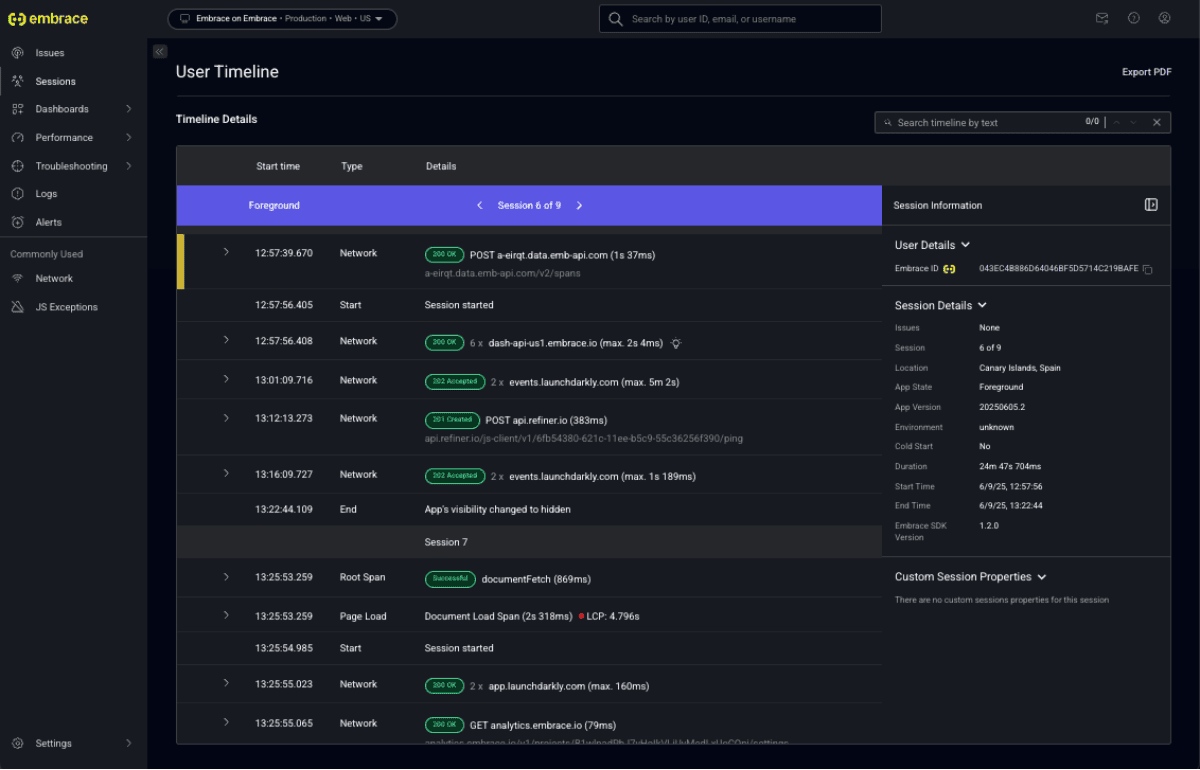
Because Embrace captures 100% of end user sessions by default, developers can look into any unique instance of an exception and retrace the exact steps the user took to trigger it via the Session Timeline, which displays a full trail of technical and behavioral events. This eliminates the need for cumbersome reproduction efforts, and instead allows developers to focus immediately on resolution. 

All JS exceptions are accompanied with a corresponding stack trace for code-level insights into the issue, directly within the Embrace dashboard view. 

Core Web Vitals

Core Web Vitals are a set of metrics designed to measure real-world user experience. They focus on key aspects of a web page’s performance: loading performance, interactivity, and visual stability.

Defined and standardized by Google, Core Web Vitals are crucial metrics because they are used to rank websites. Therefore, maintaining strong Core Web Vitals means not only ensuring user satisfaction with site performance, but also improving site discoverability and all of the commercial implications that come along with that. 

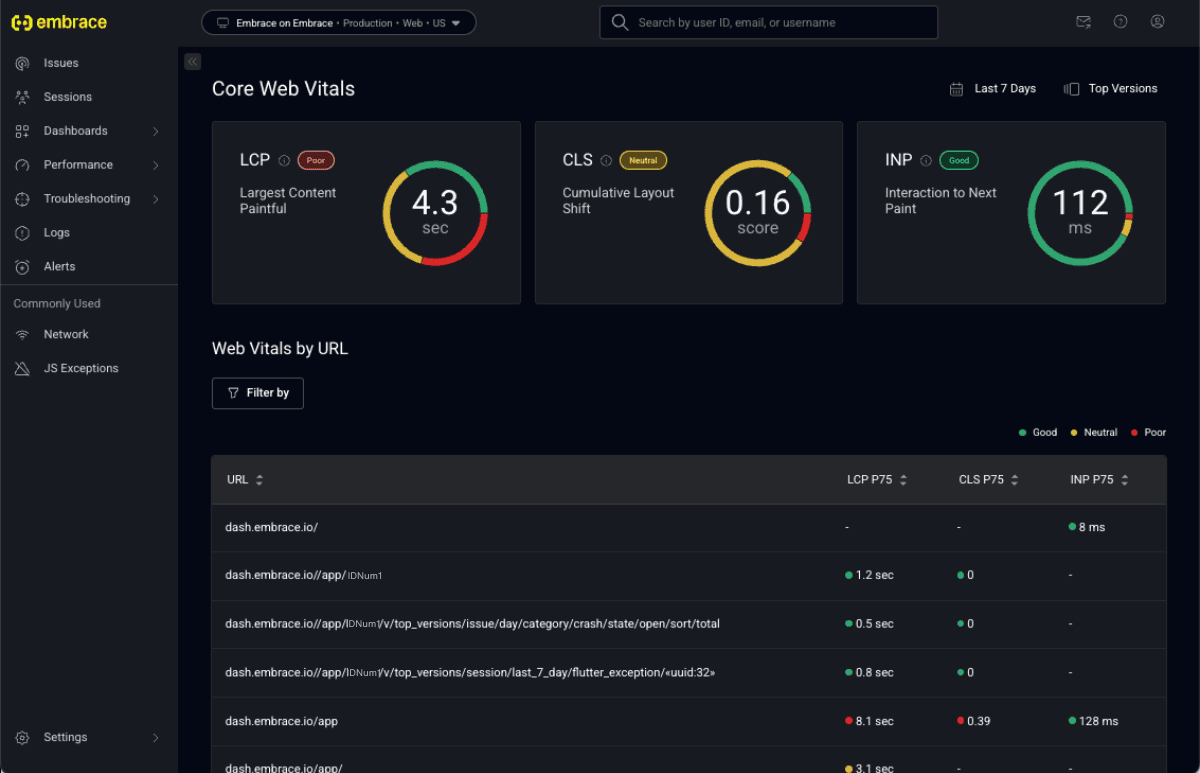
Embrace Web RUM captures and displays the three specific metrics included in the Core Web Vitals: 

  • Largest Contentful Paint (LCP): This measures loading performance. For a good user experience, sites should strive to have LCP occur within the first 2.5 seconds of the page starting to load.
  • Interaction To Next Paint (INP): This measures responsiveness. To provide a good user experience, sites should aim for an INP of less than 200 milliseconds.
  • Cumulative Layout Shift (CLS): This measures visual stability. A good user experience is achieved when the CLS score is less than 0.1.

Core Web Vitals are available in their own dedicated dashboard page in Embrace, where metrics are aggregated for a quick pulse on overall site health. Additionally, all site pages are listed with their own unique scores, with Embrace Web RUM connecting Core Web Vitals to the full technical details observed in each user session. 

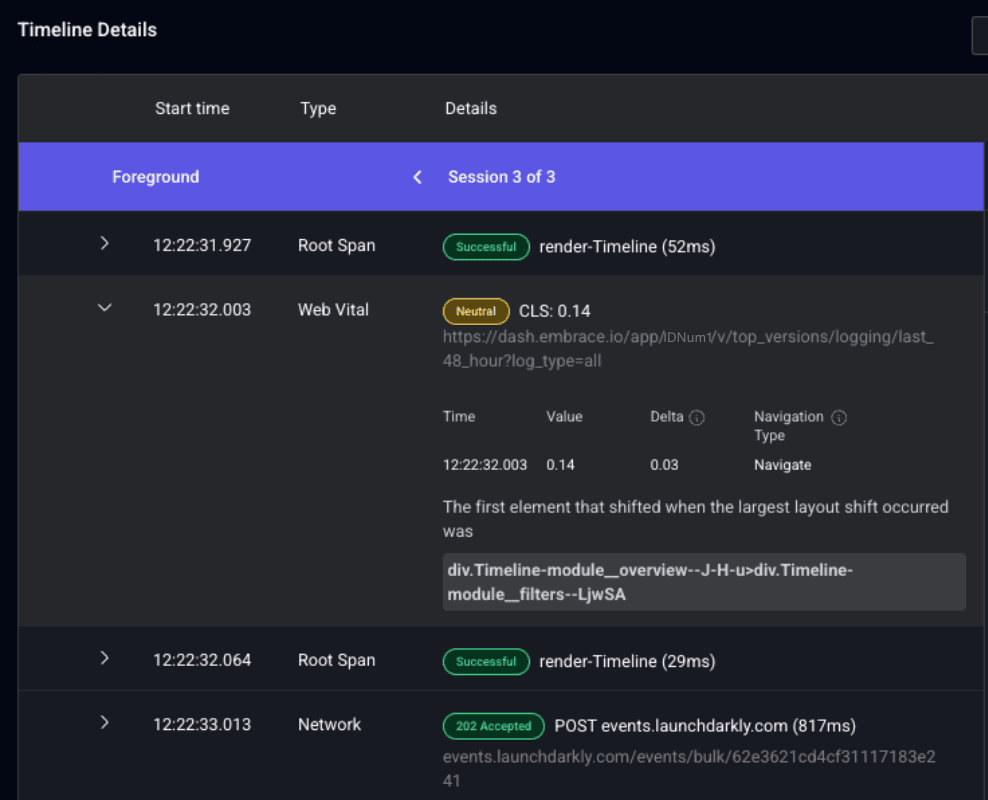
Embrace also provides detailed troubleshooting for individual instances of poor Core Web Vital scores. 

Unlike most other web RUM solutions, Embrace actually identifies the individual web element that is responsible for Google’s calculation of a web vital score. For example, the LCP Core Web Vital is calculated based on one specific page component deemed to be the “largest” contentful element. 

Without understanding exactly which element this was, developers will not be able to see the root cause of a poor LCP score and will have to undergo a lengthy process of troubleshooting to rectify the issue and improve the metric. With Embrace Web RUM, this attribution data is displayed and highlighted for every unique instance of a Core Web Vital score, giving devs far more actionable insight compared to the standard aggregate metrics that most tools provide. 

Web Session Timeline

All web performance data captured by Embrace can be examined at the individual end-user level via the Session Timeline. This is a powerful feature that has always been integral to Embrace  Mobile RUM, helping engineers isolate issues and understand them with full technical and behavioral context. With the release of Web RUM, web developers can now take advantage of this same level of data granularity. 

As mentioned above, individual Core Web Vital scores for pages across a website can be viewed within the Session Timeline, as can all JavaScript errors and exceptions. All other web events, such as page loads and network calls, are visualized in the Session Timeline, as are end-user interactions (e.g., button clicks) and more complex user flows (e.g., attempted log-ins). Developers can navigate from any unique instance of an event directly to real user exemplars that contained that event with the simple click of a button.

The power of the Session Timeline is its ability to contextualize events within the full experience of web application users, showing the relationship between underlying technical issues and their subsequent real-world impact.

User Journeys for custom flows

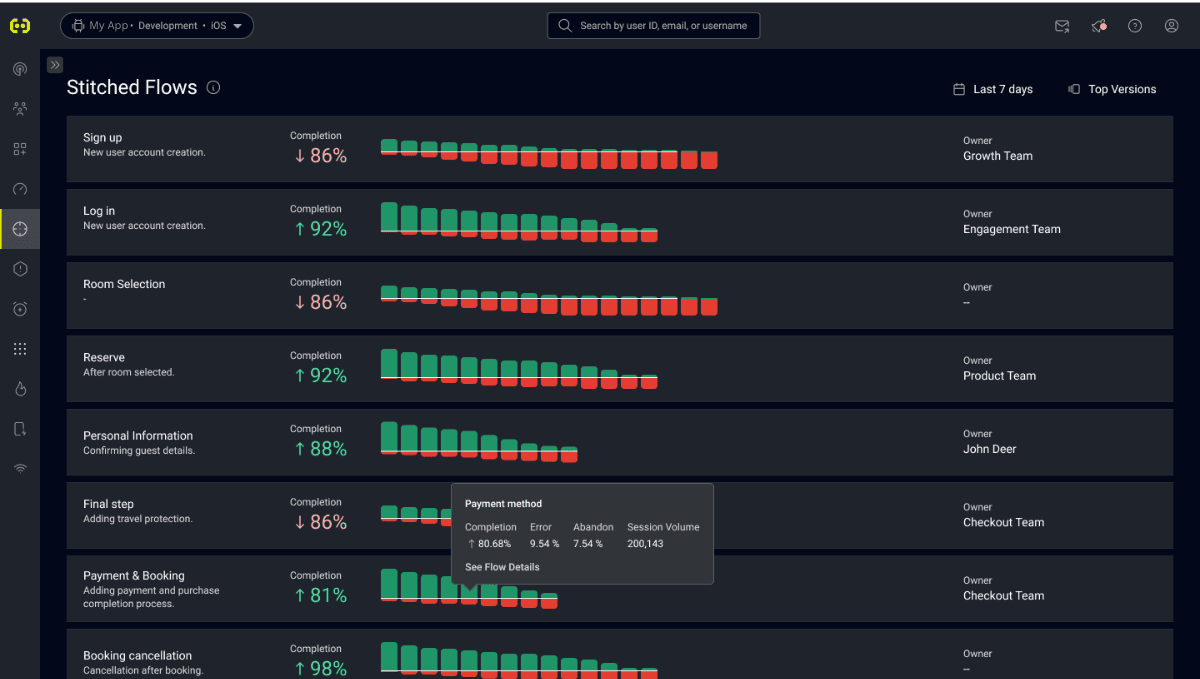
User Journeys is one of Embrace’s most exciting new features, and it’s available now as part of both Mobile and Web RUM. This feature gives engineers full visibility into complete use flows, allowing them to add data to enrich their understanding of user processes. 

With User Journeys, devs can “create” specific flows in their app that they would like to monitor and measure. These can be things like a user signing up to a service, logging in to their account, or checking out their cart. 

The process of “creating” a flow has been made incredibly easy with the advent of User Journeys. Engineers do not have to instrument anything in their application code to indicate the beginning and end of a flow. Instead, flows can be set up directly in the dashboard, based on existing data about their app that is already being collected. The type of data that can be used to start and end the flow are spans, logs, breadcrumbs, and network events.

The data types used to start and end your flow can also be mixed (i.e. you can choose to start a flow by selecting a log, and you can end a flow on a specific network response). 

Embrace will then provide actionable insights into the flow you have created. These include completion rates (how many users successfully went through this flow?), error rates (how many users could not complete this flow due to a technical issue?), and abandon rates (how many users gave up on this flow by choice?). 

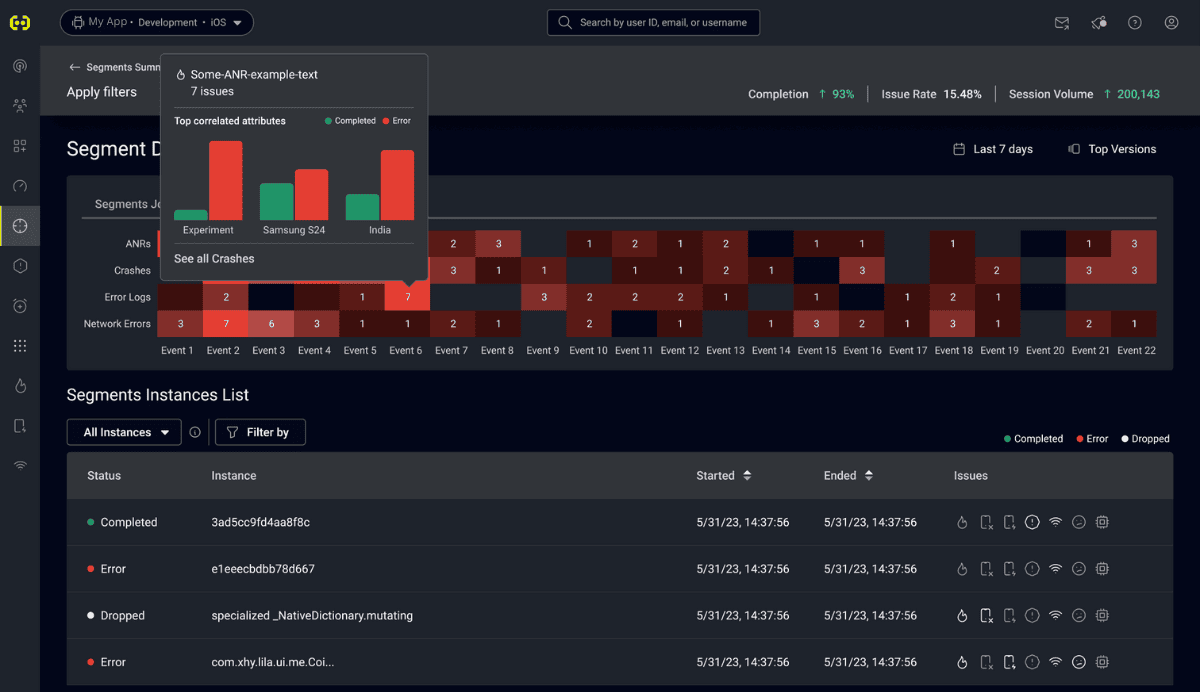
Additionally, Embrace highlights specific events, such as logs or networking errors, that occurred at any point within the bounds of the flow. Our analysis engine is then able to intelligently correlate issues and events with distinct steps in your user flow. That way, you can see if a certain step or pattern of behavior is disproportionately driving a technical problem and vice versa – if a technical problem drives your users to behave in certain ways, such as to abandon certain steps of your flow.

All flows can be investigated at the instance level. This means that, not only do you get high-level metrics on the health of your flows, but you can deep-dive into any unique instance of a flow and actually retrace that single user’s journey and their experiences. 

This new feature truly puts the user experience front-and-center, helping engineering teams in their endeavor to correlate technical performance with user behavior.

Connect the dots with OpenTelemetry

A core benefit of Embrace’s RUM products for both mobile and web is their integration within larger observability data ecosystems so that frontend and backend teams can more cohesively problem-solve issues. 

Central to this approach is using OpenTelemetry as the underlying technology that powers Embrace’s data collection. Because of its open standards, OpenTelemetry helps you future-proof your app’s instrumentation and allows easy leverage of community tools and libraries. 

Crucially, it also means that you can integrate your frontend data into existing observability pipelines. This can be done by forwarding logs, spans, and metrics from Embrace directly to backend platforms like Grafana, New Relic, Honeycomb, and others that are OTel-compliant. 

You can then view frontend metrics side-by-side with backend signals to understand the relationship between, for example, the latency of a specific service and the resulting end-user impact. You can also build more involved workflows, such as using frontend data from Embrace to power SLOs and cross-team alerts, making shared signals and insights available for faster, more collaborative problem solving. 

See Embrace Web RUM in action

To get started yourself, you can create a free account and explore our docs

We also invite you to join our Embrace Web RUM launch webinar, where you’ll get a deep-dive into all of these features, hear from the engineers that built it, and have a chance to ask questions. Register here

Embrace Join our Web RUM webinar

Learn more about Embrace's new Web RUM product from the engineers that built it.

Sign up

Build better digital experiences with Embrace

Find out how Embrace helps engineers identify, prioritize, and resolve app issues with ease.