Your app’s performance can be affected by a multitude of problems beyond just crashes. And, oftentimes, the best way to evaluate what’s really wrong is to see all of those problems in one, consolidated place. At Embrace, we’ve made some changes to our Issues Dashboard to help you do exactly that.
As a mobile engineer, this dashboard is the first screen you can check to get an overall view of your app’s health and identify any anomalies that might be affecting it. It’s also the view that will help you prioritize which issues to solve based on how many of your end users they’re impacting. Lastly, the Issues Dashboard is where you can jump-start the resolution process by collaborating with your team directly within the Embrace platform to follow, snooze, and comment on issues. Or, if you’d prefer, use one of our integrations to sync your issues data directly with JIRA.
The Issues Dashboard gives you both the quick, high-level insight you need, while also guiding you to the individual problems that require a deeper look. To learn how, keep reading for a feature overview.
Key features of Embrace’s Issues Dashboard:
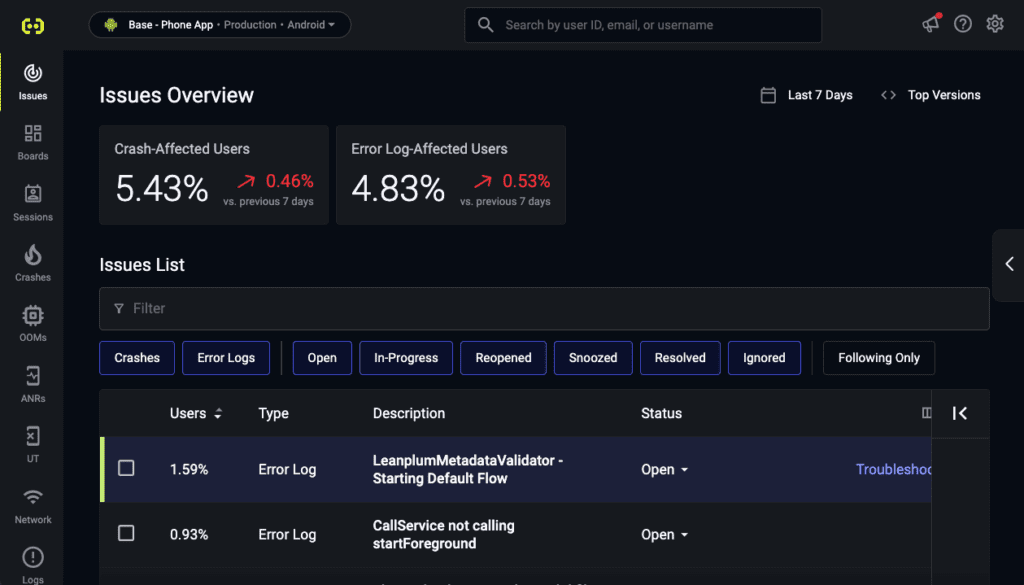
High-level metrics: The most striking data points you’ll first see on the Issues Dashboard are the high-level metrics. These are key stats that give you an immediate overview of your app’s health, and they consist of the percentage of users that have been affected by each type of issue (crashes, errors, handled exceptions, etc.). A quick glance at these high-level stats will also give you an indication of your app’s performance trends – has the number of users affected by various issues gone up or down in the last day? The dashboard makes this immediately obvious, so you know if there’s something going on you need to investigate.
Consolidated view: A major boon of the Issues Dashboard is the fact that all problems are now listed in one place. You can scroll down through the list of issues for a consolidated view of all crashes, error logs, and exceptions (for frameworks like Unity and Flutter). A true, at-a-glance view of all issues means less time spent digging around between different tabs or custom dashboards just to understand the state of your app’s health.
Prioritization and ranking: Not all bugs warrant the same amount of panic or attention, and that’s why we’ve added prioritization features to our issues list in the Dashboard. Issues are shown in rank order based on what percentage of app users are being affected by the issue. This allows you to immediately identify which ones have the biggest impact on your customer base and prioritize resolving those first.
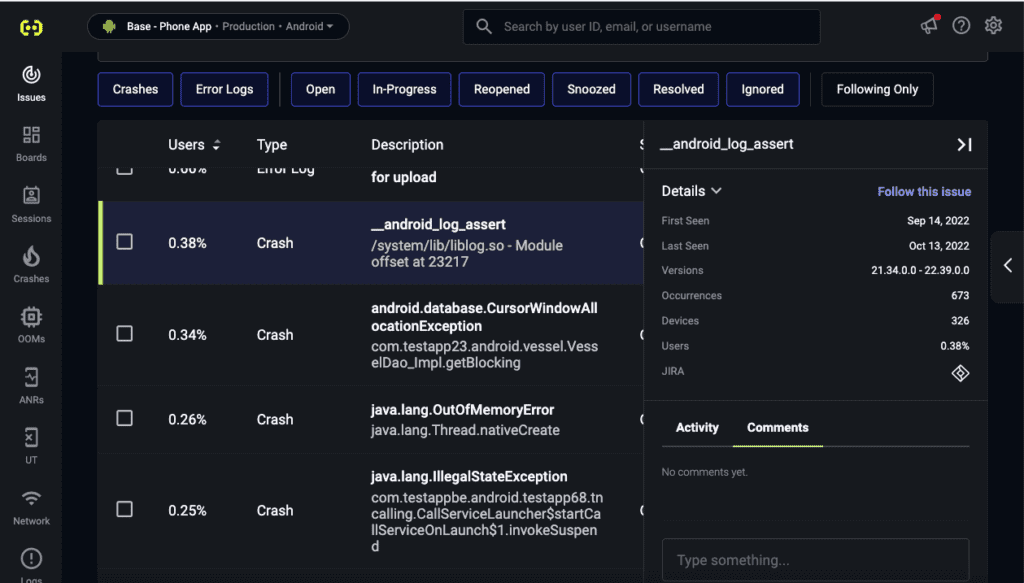
Deep-dive diagnostics: High-level stats are there to grab your attention, and our detailed pop-outs are there to keep it. Once you identify a particular issue you’d like to further explore, you can click into it for a pop-up view of key diagnostics. These include first seen and last seen dates for the issue, app versions being affected, and total number of users and devices impacted. Clicking into the “troubleshoot” link will bring you into a true deep dive, allowing you to examine trended data and stack traces for each instance of an issue.
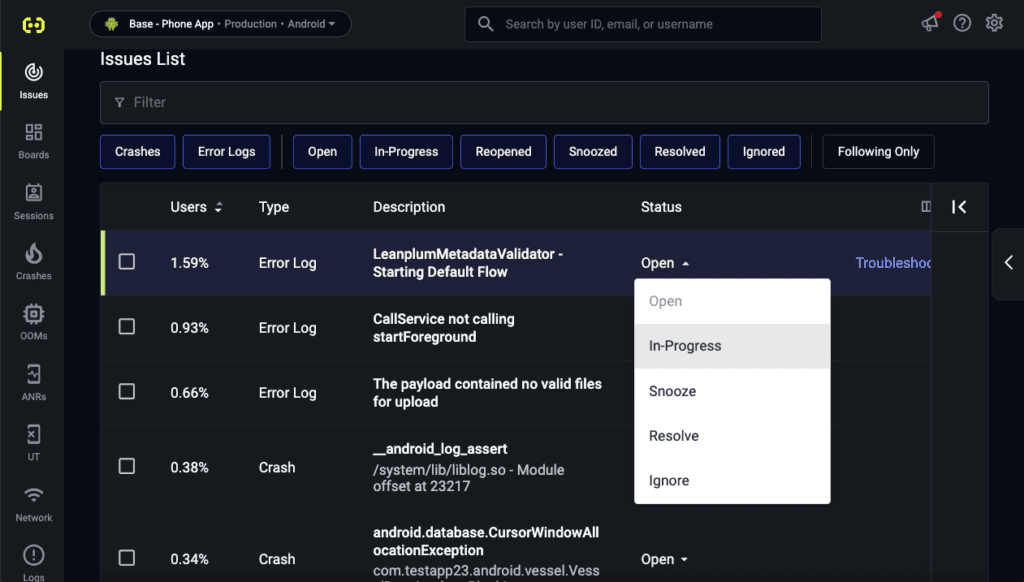
Workflow management: Collaboration is now made easier with our built-in workflow features in the Issues Dashboard. These include the ability to comment on issues directly within the platform, see the history of an issue, and ‘follow’ an issue. Everyone on your team can now stay up-to-date with the status of an issue for faster, more efficient resolution.
Tool integrations: Embrace’s Issues Dashboard helps you manage your workflow via external tools you might already be using. Our JIRA integration lets you create new tickets for issues you flag while in the dashboard, and any changes in JIRA status will also be reflected in the Embrace Issues Dashboard, creating a bridge between detection and resolution. Look for more workflow integrations to come.
More to come
Embrace’s Issues Dashboard is an effective gateway into managing and maintaining high performance standards for your customers. Through a combination of high-level stats and detail-rich data points, it enables you to identify, prioritize, and resolve even the most complex issues that might be plaguing your app.
There’s a lot more from Embrace to explore in addition to this feature. Our SDK and unified platform let you diagnose and solve most performance issues within your mobile app, so you can ensure your end users have a consistently great experience. Want to try it for yourself? Explore Embrace today.


