Network Monitoring

Network Span Forwarding is a first-of-its-kind feature by Embrace to help mobile engineers monitor their network health. It provides teams with true end-to-end visibility into failing network calls by injecting them with a unique trace ID, which can be used to identify and analyze these exact calls on the backend.
As a mobile developer, you’ve probably encountered networking issues within your app many times. Your user attempts an action, the app sends a network request to the server, and the server returns… a 422?!
This type of error is incredibly frustrating for your end users. But it’s also likely very frustrating for you, the engineer, because it gives you no real visibility into the problem. 422s, 404s, and other bad status codes are a backend problem. As a mobile dev, you likely have no insight into what might be causing this issue for your users.
So, you go to your backend team and they investigate. Using a backend monitoring tool, they might be able to identify some of the problematic calls. But they have no way of linking them back to the user sessions where they originated from and analyzing those sessions for patterns. That means no insight into any of the variables that are influencing the networking problem, such as the device types, app versions, or OS versions that are being predominantly impacted.
There is a serious lack of visibility into the journey that network calls make from the client to the backend. Monitoring solutions have typically treated these two aspects of software infrastructure as completely disconnected, leaving a huge gap in information for engineers on both sides of the stack.
Embrace’s new Network Span Forwarding feature solves this pain point. With Network Span Forwarding, you can connect the client-side and server-side systems monitoring your network requests. Using a unique trace ID, you’ll be able to follow any network request as it makes its journey from the client to the server, giving both you and your backend team the insight you need to troubleshoot a networking issue.
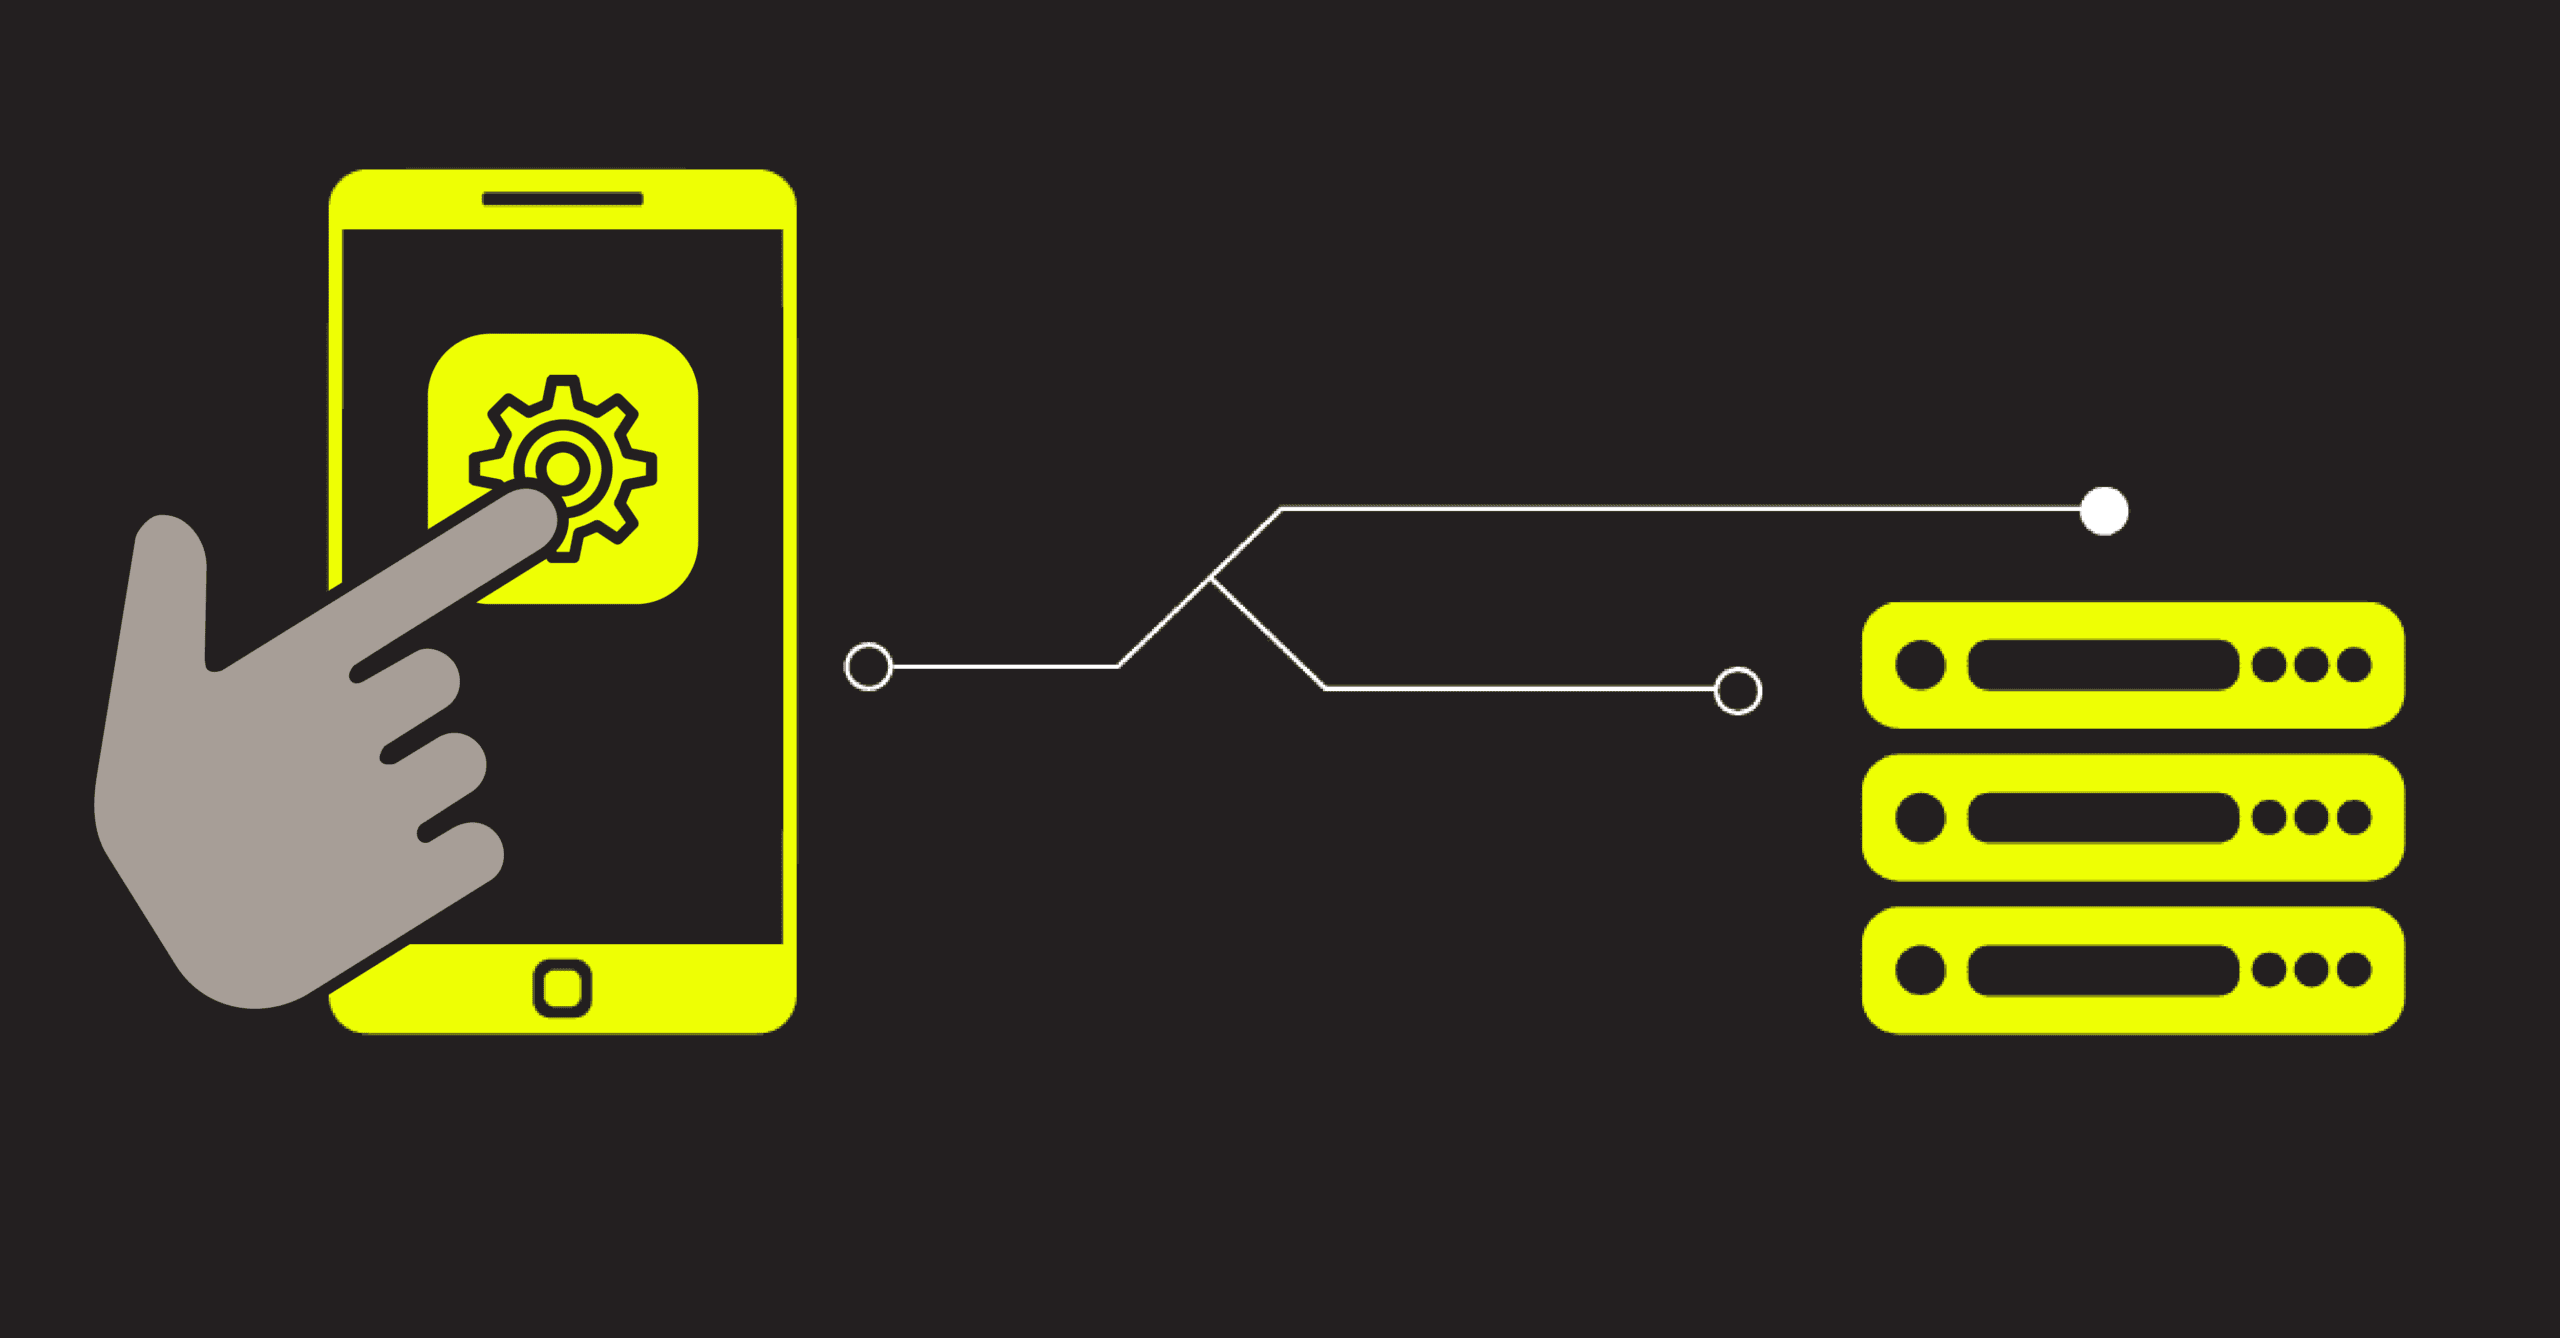
Network Span Forwarding works by intercepting a network request as soon as it’s made on the client side. When your app makes a request to the server, Embrace’s SDK intercepts this request and injects a trace parent, a tracing object that includes a unique trace ID, into the network request. The trace parent is a totally new, w3c recommended header that exists in parallel to any that you’re already attaching to your network requests. It allows for four fields: version, trace-id, parent-id, and trace-flags.
After intercepting and tagging the request, the SDK allows it to continue on to the backend. It hits the server, maintaining its unique trace ID the entire time. Having completed its journey, the network request is now uniquely identifiable by any backend monitoring solution that you might be using.
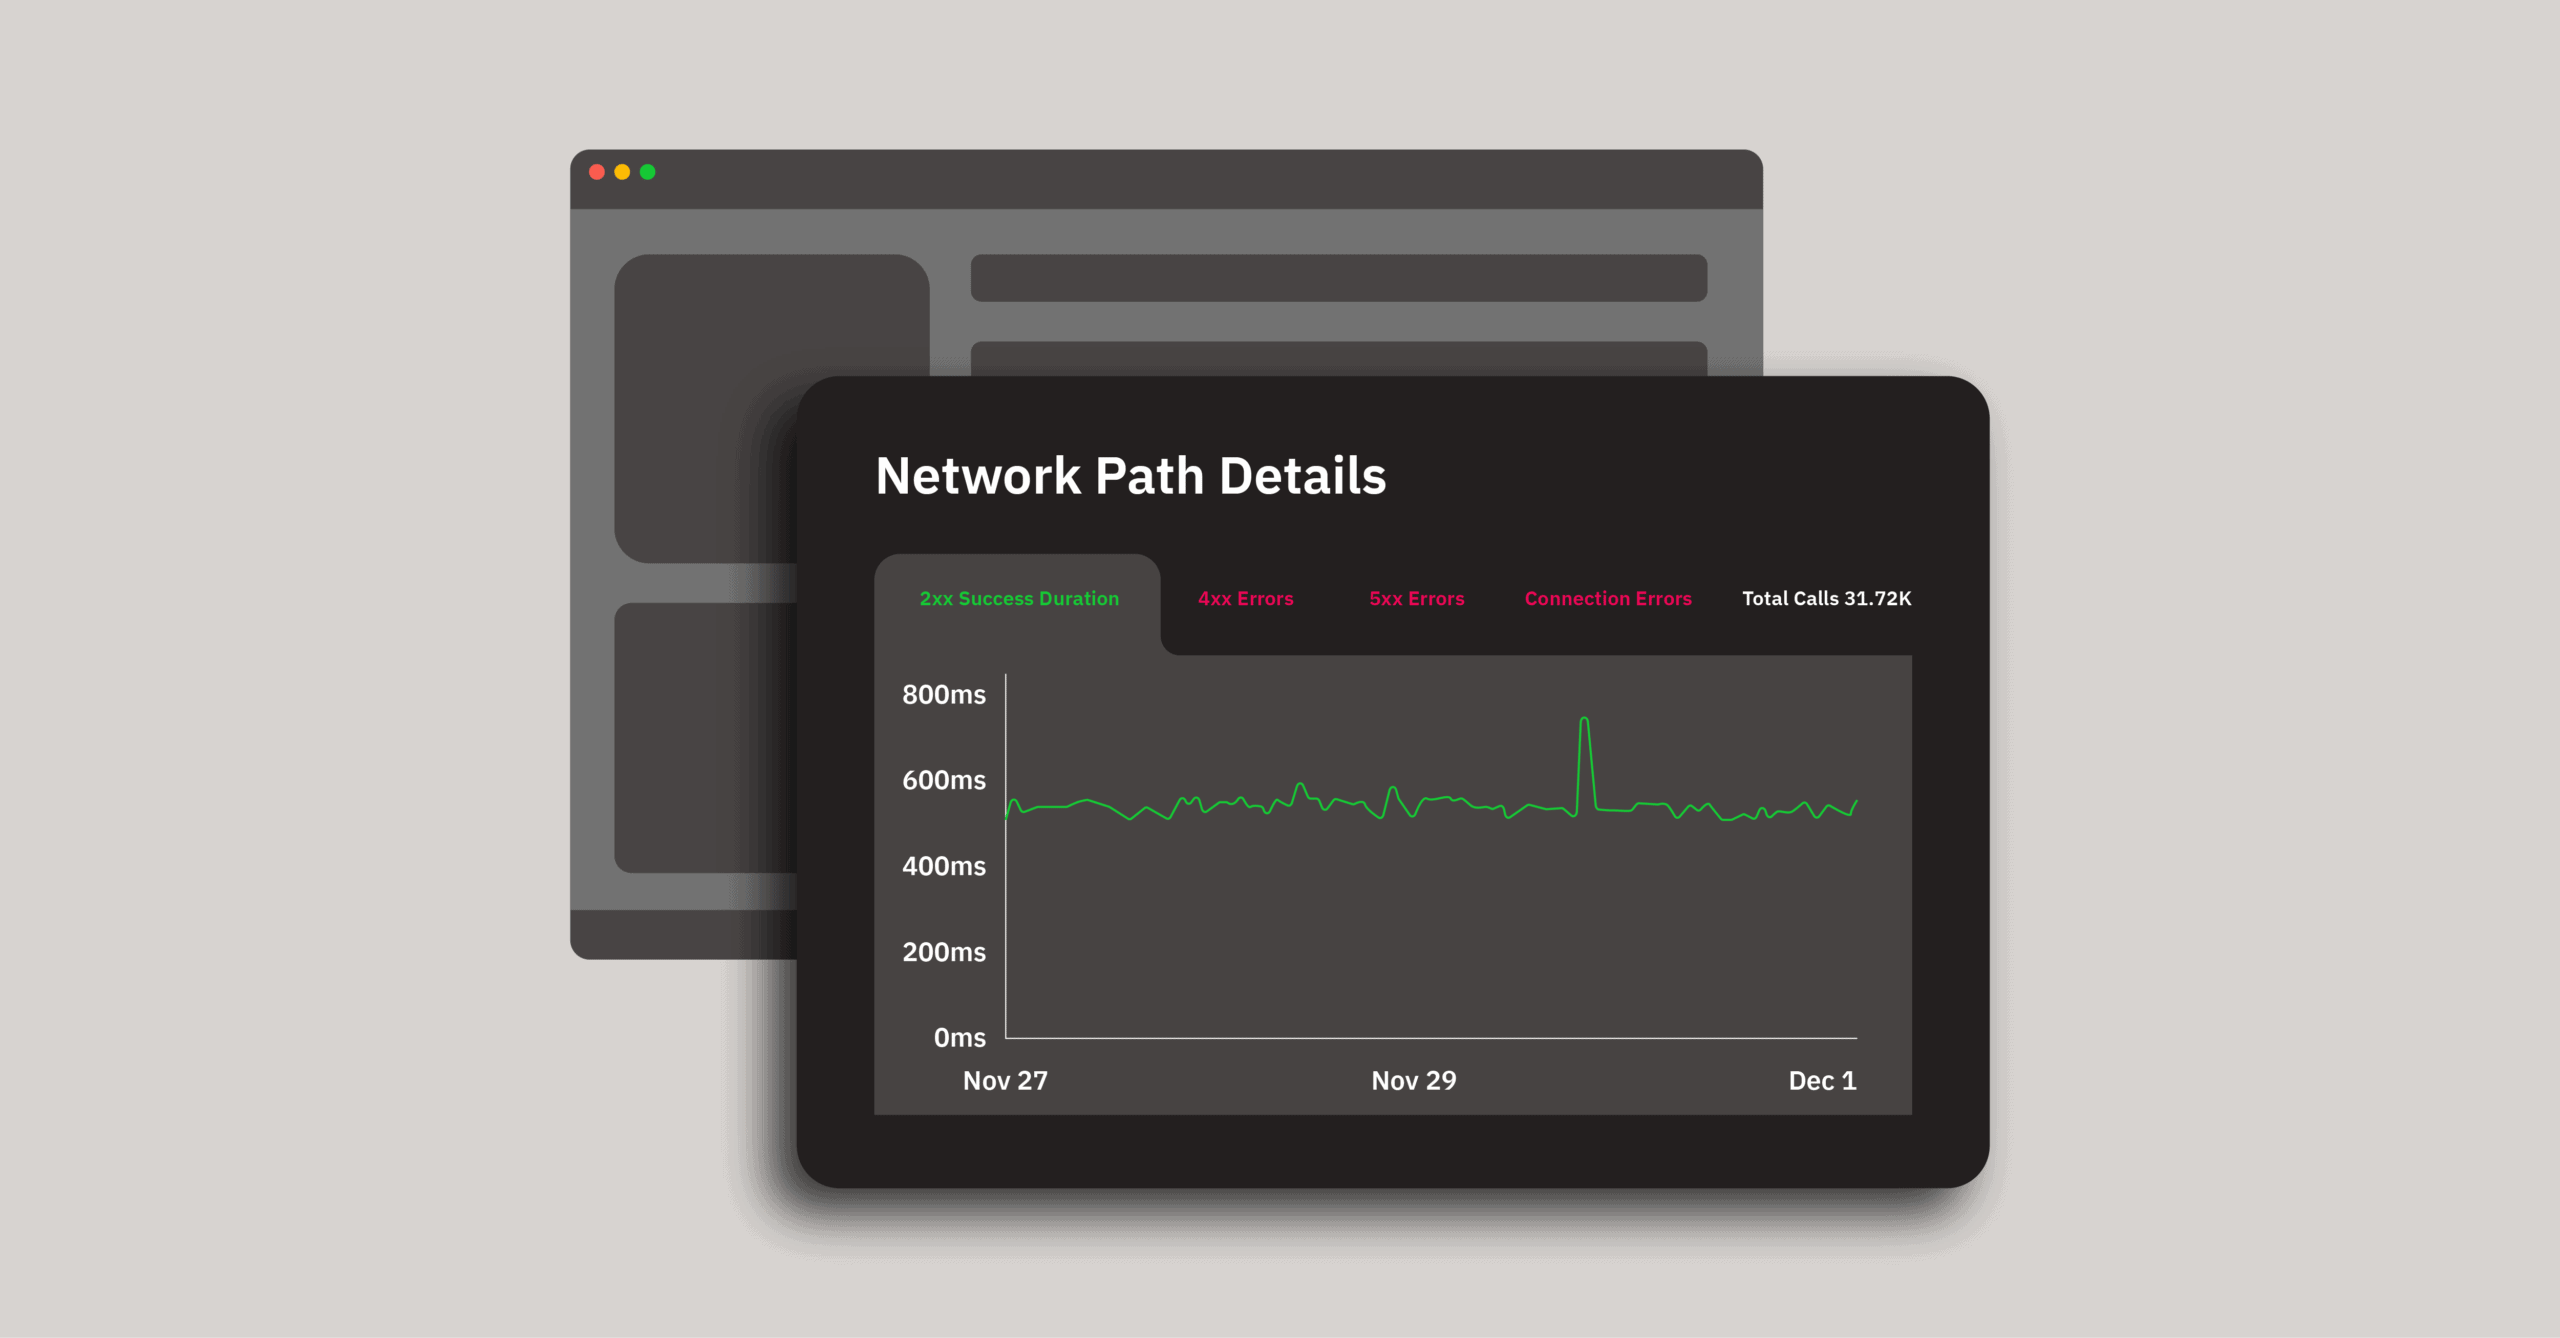
On the Embrace side, you’ll be able to see the trace ID right in your User Timeline. This puts the problematic network request in the context of a full user session, so you know the exact conditions the user was operating in, plus what they were trying to accomplish in your app, when the issue happened.
")
Network Span Forwarding bridges the information gap between mobile engineers and their backend counterparts, giving both teams the information they need to get to the bottom of a networking problem.
Let’s look at how beneficial this solution is more concretely.
As a mobile engineer, you might be seeing a handful of users experiencing a 422 error on their network requests. Luckily, with Network Span Forwarding, these requests have been tagged with a unique trace ID by the Embrace SDK. You can go into the User Timeline, find these bad requests, copy the unique trace IDs, sync with your backend team to look at their monitoring tools, find those exact network requests, and ultimately see how the endpoint processed them. Having the exact trace IDs, you can arm your backend team with info about the users’ app environments and states to help them analyze and identify any systemic issues that are causing the problem.
Troubleshooting these issues works the other way around, too. Your backend team might be the ones to notice something wrong with the requests first. Because of the unique trace IDs, they can flag these requests with you, the mobile dev, who can then open up your Embrace dashboard to investigate them. Because these unique network requests appear in the User Timeline, you can analyze them with ultimate precision – at the individual, timestamped level of the user session.
With Network Span Forwarding, you’re able to take very fast, actionable steps toward solving a huge frustration for your end users, a frustration that, until now, has unfortunately offered up no data or context for mobile teams.

In addition to this granular view into network calls, Embrace provides high-level insight into your app’s overall network heath and connectivity, crash rates, user actions, and other key aspects of technical performance.
Our data-rich issue detection and resolution tool is specially designed for early discovery because we capture the full story for each individual session. That means that you’re able to catch early performance risks as soon as they start impacting even just a handful of people, rather than 5-10% of your entire user base.
To learn more, check out the rest of our product suite, or request a demo to see how our solutions can help you maintain fast, stable, and all-around amazing mobile app experiences.
Get started today with 1 million free user sessions.
Get started free