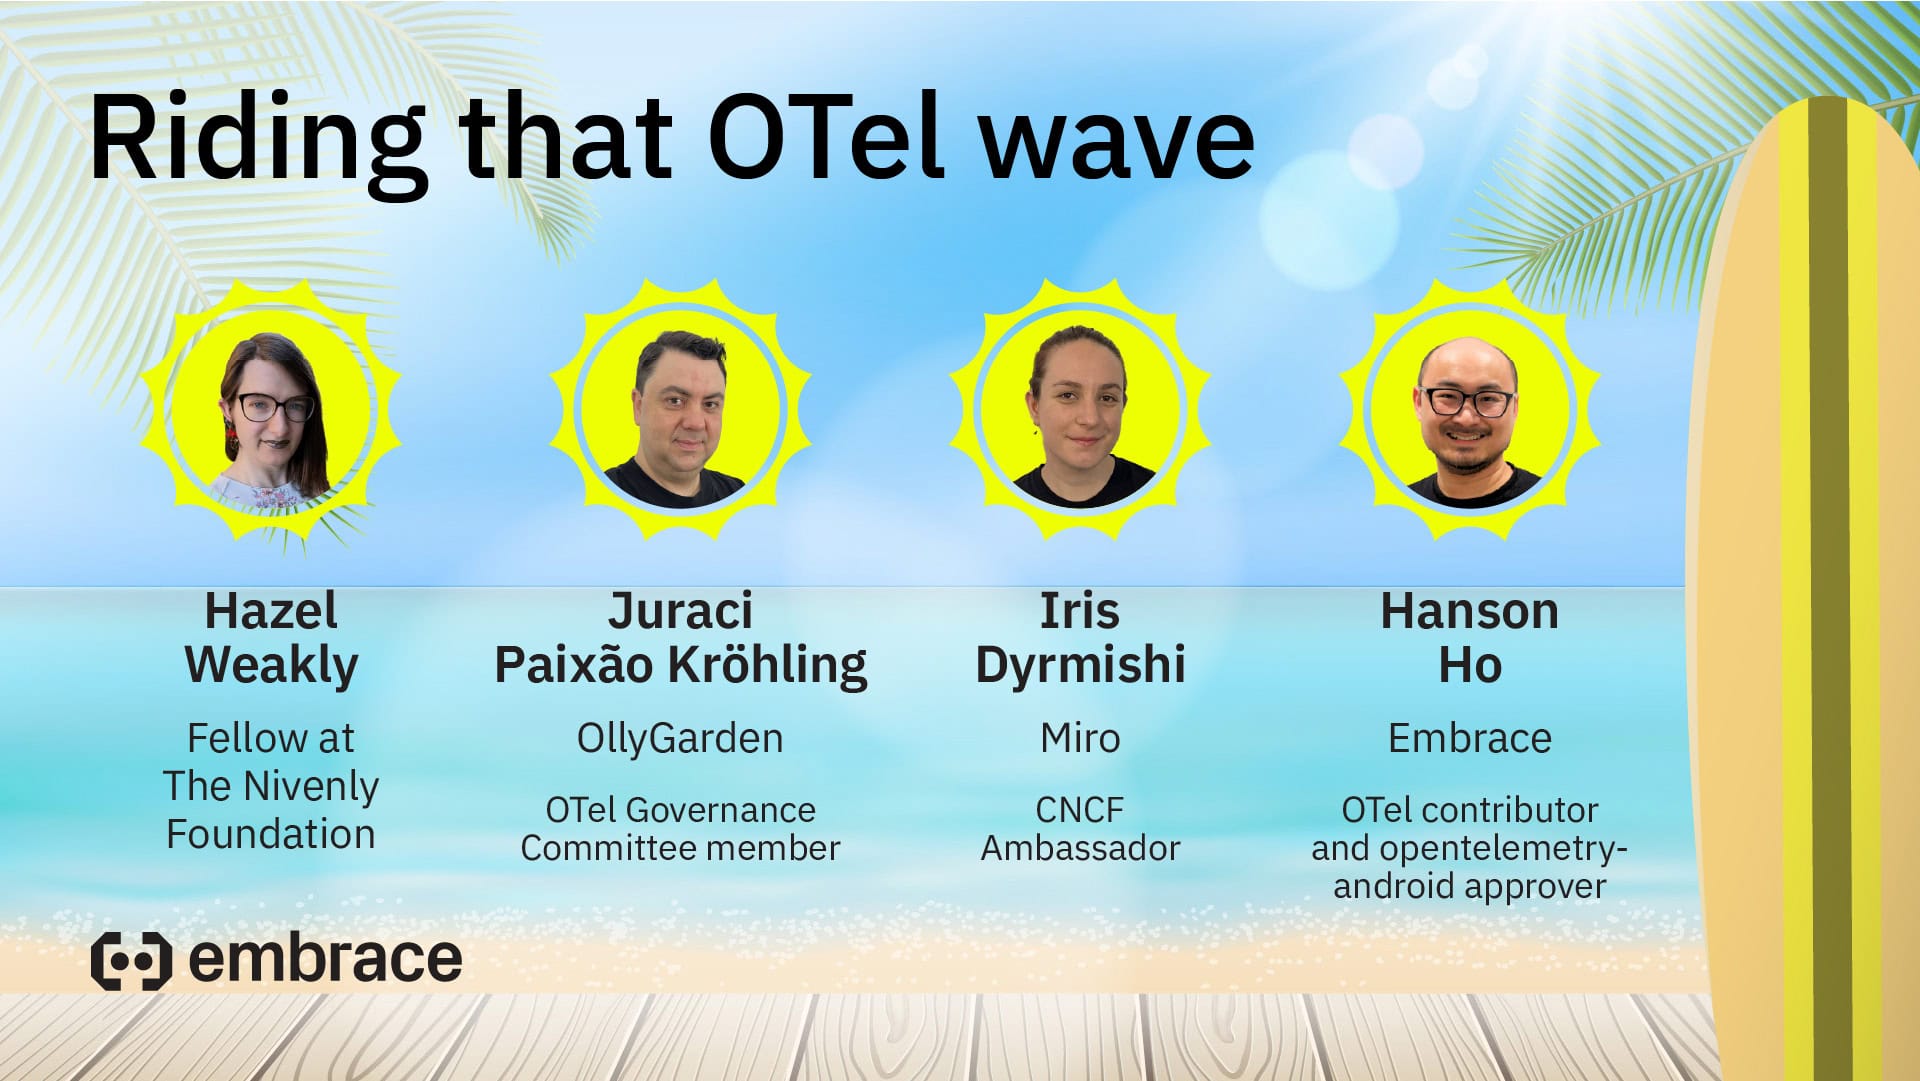
Recently, a fun group of OTel experts and enthusiasts gathered for two reasons – getting ready for summer and chatting about how we can improve observability and make it easier to understand what’s going on with our software systems. (You can watch the full video here.)
In other words, we wanted to help you learn how to hang ten on some sweet OTel and observability waves. I guess we could also call it “ob-surf-ability.”
I’ll wait here for you to recover from that facepalm.
Wherever you are on your OpenTelemetry or observability journey, there’s definitely something for you in this wide-ranging discussion. Here’s just a small sample of topics we covered:
- What are some strategies for large engineering teams to successfully get started with OpenTelemetry
- Why observability engineers must highlight the value of using OpenTelemetry to developers and not just senior leadership
- Why you should strive for purposeful instrumentation in your telemetry (and yes, there are many reasons beyond reducing costs)
- What are tools and architecture approaches to improve how you work with the OTel Collector
- Why collecting telemetry in the OTel data format is so hard for mobile and web apps
- If OTel for mobile was a sandwich, what are the condiments, meat, and bread? (Yes, this was talked about.)
If you’d like a sneak peek at some of the highlights, read on! We’ve got key panelist quotes, favorite answers to questions, mic drop moments, OTel resources, and more. If you’d prefer to check out the video instead, you can watch the full panel discussion here.
Hope you enjoy it, and we’ll see you at the next one!
Key quotes from the panel

Hanson Ho
On the current level of OTel support for mobile
“So there’s some rough edges, but not unovercomeable rough edges. So we [Embrace] just started to create a Kotlin API for the tracing spec. And we hope to develop an SDK soon, as well as fill out the rest of the OTel APIs. Because, you know, folks on Kotlin Multiplatform, as well as just Android developers who don’t really know Java, really would like something that looks like it’s for them and built for them. And we’re hoping to do this in a way that’s not related to Embrace and just, like, have everybody be able to use it because I think we believe that if everybody uses this stuff, they’re going to demand better stuff. And I think everybody wins.”
On how to add context to mobile crash data when using OTel
“There are fields, they’re called attributes, and you can stick anything you want there in terms of context or metadata or additional information. What you have, what you want, is structure though. You don’t want to put all that stuff in the body and say, hey, parse it in order to actually extract value. Attributes are there for the reasons that was stated. So they exist, you just put it there. And one day, we’ll have a semantic convention when I submit it or somebody else does. So we’ll get there, we’ll get there.”
Hazel Weakly
On the cost versus value of observability
“And so one of things that I think about so often when it comes to cost and so often when it comes to understanding the system is that nobody really complains about the cost of business analytics or business intelligence tooling. It costs a lot, you could complain about it a little bit, but it’s so directly correlated to the value that you get out of it, to the ability to understand what the business needs and how to go from there, that it’s a worthwhile investment. And so I don’t think of cost optimization, I think of strategic investment. It’s not about making the cost go down, it’s about spending on the right places.”
On the value of sharing observability process instead of just knowledge
“Historically, a lot of the justification for OpenTelemetry has been around answering unknown unknowns, which is something that, ‘Can you without re-instrumenting the application, […] can you answer a new question during an incident?’ The way I like to think about that is, can you learn from your system over time? And if I think of team and organizational dynamics and how humans think and learn, it turns out that humans don’t learn in terms of sharing knowledge. We learn in terms of sharing process. […] What I want to do is, I want to share a process. ‘Here’s how to find out.’ ‘Here’s how to understand.’ ‘Here’s how to dig in.’ ‘Here’s how to slice and dice and think about things.’ ‘Here’s how to problem-solve.’ If I can share that process, you can take that, and you can do that with any of the systems that you build, not just the ones that you understand.”
Juraci Paixão Kröhling
On why you need to educate developers about observability
“We forget that developers, they don’t care about security. They don’t care about observability. I mean, sure, they care, but they don’t, right? […] We have to help them. And we don’t help them by teaching them PromQL. That’s not the point. The point is, do you know how long your users are waiting for an answer from your service and how much of that answer is caused by your downstream services? So that’s why they care. And I think if you have this mindset that, you know, devs are not observability engineers, I have to bring them answers with value, then you’re going to have a successful implementation of OpenTelemetry.”
On the importance of purposeful instrumentation of telemetry
“I think purposeful instrumentation is you looking at the instrumentation that you’re doing right now and making a decision. Am I instrumenting the right thing? Am I, do I actually need the client ID as part of my attributes for this metric? Probably not, right? Metrics are aggregations. So perhaps I don’t need to aggregate at a client ID level. And that’s the kind of thinking that goes into purposeful instrumentation. You think about the scenarios where you might need that data and you select which signals and which attributes you actually need for that.”
Iris Dyrmishi
On why your OTel Collector configuration is so important
“When you are instrumenting the data, yeah, it’s very important to know what you want and what not. But there is also another part of the configuration, which is the Collector. You can enrich your data in a million ways there, and sometimes you can go crazy. So you need to know the purpose of what you want, how you want to transform your data, what exactly you want to add or remove from your data. So there’s, like, the instrumentation, then the part of when it goes into the OTel Collector pipelines and, of course, in the backend.”
On why you shouldn’t rush an OTel migration
“It’s something that shouldn’t be rushed because it goes both ways. Some are skeptics and some are, like, ‘OpenTelemetry is the best thing that has ever happened! Let’s migrate to it immediately.’ And in the process things are breaking, dashboards are not working, users are not happy, so in big organizations it can cause that thing: ‘Okay, we introduced OTel, but we didn’t actually fix our problems.’
“So do not rush it. Release slowly. Use the tools and learn the tools very well. We’ve already mentioned so many good things that can be done and so many different ways to implement it. So it’s important to understand that before you introduce it to your organization.”
Favorite answers to how to get started with OpenTelemetry
Juraci Paixão Kröhling: “I was a QE, a quality engineer in the past. One of my techniques in dealing with a new code base was, ‘Where is it burning?’ I mean, ‘Where do I find most of the bugs?’ And that’s where I start. That’s where I add more unit tests. That’s where I increase quality. The same with observability, right? So, what are the services that are causing the most alerts in the middle of the night for me? So that’s where I can get started. That’s where I add more instrumentation. That’s where I start observing. You’re not gonna observe your whole fleet of 26,000 microservices in one week, right? It’s not gonna happen. Take the ones that are small enough and are noisy enough and just do it.”
Hanson Ho: “So I think before you start with any lines of code or anything technical, you’ve got to align the organization, especially the incentives in each stakeholder. If you have your CEO, your product people say, ‘Hey, this is great. It sounds great.’ You got to make sure the mobile team is up for it. Do they want to actually own this? Do they want to find additional problems with their app that they’re already struggling to fix issues with?
“So if your mobile team doesn’t wanna do it, you can’t really force them. I mean, you can, but there are ways for actual teams at the team level to do it. And if your team wants to do it, but there’s no support at the higher levels to identify which are important workflows, what KPIs they wanna actually measure, then what they get is just a bunch of data that doesn’t connect to anything useful. So unless everybody buys in, it’s gonna be very difficult to roll out successfully.
“You can certainly get an implementation that has some data and that provides some value. But to truly leverage any of this stuff, everybody has to be bought in or at least not be resistant to it. It has to be okay or better, enthusiastic or I’m not gonna block it. So unless you find that fit in your organization, don’t even try because it’s just gonna be a waste of money.”
Favorite answer to “What is the current level of OTel support in mobile, and can people use the OTel Android and Swift SDKs?”
Hanson Ho: “Yes, I mean, it works, but it is not designed for it, shall we say, especially in the backend tooling and the Collector part. Traces work great. Spans work great if you’re thinking of modeling performance traces. But if you want to use that signal to do something that’s not strictly like a performance kind of view into a workflow, it becomes a bit challenging.
“Similarly with logs as well. I would say we’re in the process of making things better. There’s a lot more activity, I think, over the last few months. Every time I say this, but every time there’s more. So we’re really building momentum, I think, in the mobile space, trying to take something that was designed for the backend to monitor backend devices, app performance, to something that is more user-centric, user-focused, to link it to performance for client applications.
“So there’s some rough edges, but not unovercomeable rough edges. So we [Embrace] just started to create a Kotlin API for the tracing spec. And we hope to develop an SDK soon, as well as fill out the rest of the OTel APIs. Because, you know, folks on Kotlin Multiplatform, as well as just Android developers who don’t really know Java, really would like something that looks like it’s for them and built for them. And we’re hoping to do this in a way that’s not related to Embrace and just like have everybody be able to use it because I think we believe that if everybody uses this stuff, they’re going to demand better stuff. And I think everybody wins.”
Favorite answer to “How does OTel being vendor-agnostic weigh into the decision process for whether to adopt OTel?”
Iris Dyrmishi: “I think it’s the biggest justification that you can give outside the engineering team, mostly the senior leadership about why you want to use OpenTelemetry. And I usually do that by giving some examples. […] You have a vendor, everything is working great, but then they’re… you’re not compatible financially anymore.
“You will have to pay a million dollar bill. One million is a little, but several million dollar bills. And it’s like a ransom that you cannot pay, or you do not think that it has enough value. Or this vendor is just not progressing like the rest of the other vendors, or it’s not having the features that you want. So either you will have to pay this crazy amount of money, or you will have to migrate to yet another vendor.
“And imagine the workforce that goes to that and the changes and the months and months that it’s going to take. So this makes for a great case to leadership about going to a vendor-neutral, agnostic solution because there is a very big chance that if you are depending on another company, they will move forward and produce things that do not fit your use case anymore.”
Mic drop moments of the panel
Hanson Ho: “So certainly people talk about costs a lot of times to think about storage and processing in the backend, but on mobile, the cost is also in the collection. So even if you’re like, yeah, I got some sampling going on, tail sampling. Well, anytime you collect data, it is costly on Android depending on where you do it. Not just Android, too. iOS and other mobile devices just because they sometimes are 10 years old.
“Have you profiled your Android Go device lately? And if you have, you should take a look at how long it takes to record a trace and do stuff. And if you do it in the wrong thread, it could actually bring overhead that makes your performance worse. So be careful what you do. Do it purposefully and do it understanding what the cost is to your users, your end users, not how much you’re paying for Amazon bills.”
Juraci Paixão Kröhling: “When was the last time that you profiled your backend services? And the point back there was it’s easy to collect on the backend and filter at the Collector side.
“And I’d argue that the Collector is a stopgap solution. You should definitely do tail sampling. You should definitely do PII cleanup at the Collector. But you are still collecting. You are still at SDK, at your application, you are still processing. You have processing cycles, creating that data, placing it in memory, queuing up, and exporting that data somewhere. You have traffic between those two services. You have network.
“So go back there and clean up the data at the source. If you have the chance, not only at the mobile application, because it is important to your users, but also on your microservices. They might be micro, but they are using up resources as well. So do care about your AWS bill that Hanson told you not to.”
Favorite answer to “What’s in your OTel picnic basket?”
Hanson Ho: “So when I think of bringing stuff to the beach, I always think about food. So a sandwich is what I would bring. In the context of mobile, an OTel sandwich, what folks normally instrument are telemetry about the app itself and how it’s performing. For an OTel mobile sandwich, that’s just the condiments. That’s your ketchup or mustard or mayo. But the meat of the sandwich is user behavior. What you want to know is understand what your user is doing with respect to how they’re using the app and whether they’re getting stuff done. The performance is the condiment that accents the user actions. So it’s there, it’s necessary, but really it’s about to highlight what the users are doing and have performance linked directly to it.
“Of course, you need bread. What’s bread in an OTel sandwich, but the context and metadata. That allows you to slice and dice. And it’s not a sandwich without it. You can’t have just meat and condiments. So whether it’s gluten-free bread, whether it’s like, you know, regular bread with gluten, it has to be there. Something has to kind of make it all tie together. And that’s context. And that’s everything around it. And with that, you get a really delicious OTel sandwich that is nutritious and makes you understand things, like how hunger doesn’t feel so bad.”
Favorite exchange
Hazel Weakly: “What is the mayonnaise of OTel?”
Hanson Ho: “Of OTel? Well, I can say what the mayonnaise of mobile telemetry is, which are crashes. It’s the one that’s ubiquitous because it’s easy to get. It’s everywhere, but it’s kind of useless unless you actually do something with it. So that’s, like, a log. If you use an OTel log and you just kind of like don’t put structure around it and just kind of like just keep gobs and gobs of log, it’s just going to clog up your arteries and it’s going to make your whole sandwich disgusting.
“So would say logs, or rather unstructured logs, is the mayonnaise of OTel. And for mobile, that’s crashes.”
Favorite answer to “Beach, please!”
Iris Dyrmishi: “‘Beach, please,’ can we get some more love for frontend and web observability? Yeah, of course, backend observability is very well established now. I mean, of course, there is still work in progress, but it feels like frontend is the forgotten child. And a lot of companies are using more of the proprietary technologies that the vendors are offering right now. So it goes kind of against this whole vendor-neutral thing, but that’s a tooling that we’re having. So, I’d love to see some more love there, some more action. I’d love to be there to try it and to implement it.”
Favorite response to why OTel seems more suitable for backend telemetry
Hazel Weakly: “If you look at the history of OpenTelemetry, it absolutely was designed for the backend. It was designed for microservices and specifically for microservices with manual instrumentation. And the manual instrumentation and the depth of the call chain typically did not tend to be more than three levels deep.
“And so you’re seeing a lot of friction currently, and mobile, for example, saying, we need to be able to send things in the shape of the OpenTelemetry, you know, the spans and the traces. Really tricky. It’s really tricky to reason about and Embrace actually has to do a lot of interesting things in order to bridge the gap between the data model that OpenTelemetry wants and the data model that works best for applications.
“Internet of Things is also encountering that. And it also turns out that we’re seeing the same types of problems come up with streaming applications versus batch applications versus serverless versus different models and contexts. When it’s not a microservice or when it’s not a REST API, you’re running into these little gotchas, but they’re not inherent as a limitation. They’re just things that we will get into and things we’ll be able to address.”
Resources about OpenTelemetry
Here are the resources our panelists shared:
- OTelBin: https://www.otelbin.io/
- zPages: https://github.com/open-telemetry/opentelemetry-collector/blob/main/extension/zpagesextension/README.md
- tail-sampling: https://github.com/open-telemetry/opentelemetry-collector-contrib/tree/main/processor/tailsamplingprocessor
- otelconf: https://github.com/open-telemetry/opentelemetry-go-contrib/tree/main/otelconf/v0.3.0
- oteltui: https://github.com/ymtdzzz/otel-tui
- otel-lgtm: https://hub.docker.com/r/grafana/otel-lgtm
- Apache Arrow: https://arrow.apache.org/
- OTel Weaver: https://github.com/open-telemetry/weaver
Full transcript
Colin Contreary: Hello everyone, and welcome to today’s event, “Riding that OTel wave.” I am Colin Contreary. I’m the head of content at Embrace. I will be today’s moderator. We’ve got a wonderful panel of OTel experts who are really into two things: getting ready for summer and chatting about how we can improve observability and make it easier to understand what’s going on in our software systems.
So we are here today to help you learn how you can “hang ten” on some sweet OTel and observability waves. So I guess what I should say is instead we’re here for “ob-surf-ability.”
All right, that’s right. This discussion is all about catching some sun, having some fun, and using OTel to reduce issues in production for everyone.
We will be covering what goes into our OTel picnic baskets, such as the signals and tools that we rely on every day. We will share how we got, and how you can get, a sweet observability tan. So you’ll hear success stories and helpful suggestions for starting, scaling, or maintaining your observability systems. We will also cover where OTel is leaving us, ooh, a bit sunburned at the moment, and where we’d like to see it make some progress.
In addition, we’d love to answer any questions you have as well. So ask your questions in the Q&A section, and we will answer them either during the panel or during a dedicated Q&A section at the end. So with all that out of the way, we’ve got a poll question going and while people get their answers in, let’s meet our panelists. So Hazel, would you like to go first?
Hazel Weakly: No, just kidding. My name is Hazel. I have thoughts, lots of thoughts. They never stop thinking. They never stop thunking. And I am very excited to be here today and talk about OTel, all things summer, and hopefully you can’t see the sunburn tan lines that I still have from a conference that I was at a couple of weeks ago. Who knew that the Pacific Northwest also experienced summer occasionally?
Colin Contreary: Yes, sometimes it does have some summer. Iris, would you like to go next?
Iris Dyrmishi: Absolutely. Hello, I’m Iris Dyrmishi. I’m a senior observability engineer at Miro. So I talk a lot about engineering, observability. I dream about observability. I have a little charm here with observability. And I’m connecting here from one of the capitals of surfing in the world. I’m from Portugal. I’m talking to you from Portugal, and here I have my little tropical drink, which is just a cider, non-alcoholic, but with some blueberries for some flavor. And yeah, I’m very happy to be here.
Colin Contreary: Nice, awesome. So your bracelet says like the words observability on it. Is that what you said? Oh, nice. I dig that. Very jealous. All right, Juraci. Can you go next?
Juraci Paixão Kröhling: Yeah, absolutely. Hello, everyone. My name is Juraci. I’m a software engineer at OllyGarden. My summer drink is cold coffee or iced coffee. And my perfect summer location would be by the beach in a very nice place in Brazil, if I can choose. But this year, I’ll probably stay here in Berlin and surroundings, so enjoying the lakes in Berlin and Brandenburg.
Colin Contreary: Nice, awesome, thank you. And we will round it out with Hanson.
Hanson Ho: Hi, my name is Hanson Ho. I’m a Chinese guy with dark glasses. I am an observability enthusiast here at Embrace. I work on Android mostly, but I do mobile of all things in terms of what I like. I’m so into observability. My son is named Ollie. So there you go. And my summer drink is water because water is the essence of life, and you need to hydrate and you can’t do nothing without water.
Colin Contreary: Very nice, Hanson.
Hazel Weakly: How very healthy of you.
Colin Contreary: Yeah, so I was going to say I skipped over my drink. My tropical drink is a half iced tea, half lemonade, which is a… will dehydrate you. So yeah, the opposite of Hanson’s drink. That was awesome. Thank you all for your intros. Let’s close this poll question and see what one… and it looks like, “hiking and camping in nature” is what everyone wants to do in summer. Relaxing on the beach was second.
Looks like we got our theme a bit off as the people at large would rather be in nature, but you know what? That’s OK. Alright, let’s get into our first discussion question. So our first question is, “How do you create your perfect OTel picnic basket?” So for example, what signals and tools do you use, or would you bring into a new project? Which ones are you excited to try? Let’s get into that and let’s start off with Juraci if you can go first.
Juraci Paixão Kröhling: Yeah, absolutely. So I guess the first tool that I have to bring with me is the Collector, right? I’m also a tracings person. So that’s the first thing that I bring with me as well. Whenever I think about instrumenting something, it has to be with tracing first. And tracing, Collector, they get along well together. And when instrumenting code, what I’m enjoying nowadays, at least this season, is otel-conf, right?
Otel-conf is a, well, the SIG configuration is a new SIG or relatively new SIG in OpenTelemetry. And I think it is a much necessary SIG. Like we struggled for too long on how to configure SDKs when doing manual instrumentation. And the SIG configuration comes with the tooling and the semantic conventions to do configuration very similarly across all of the SDKs. So that’s what I’m doing right now when using Go. So when I use Go, I use otel-conf to do the configuration for me or to help me doing the configuration. And once everything is configured, once everything is ready to be visualized, I typically use otel-tui, Terminal User Interface, which is quite neat. And you can just quickly start it off. I started up and take a look at the signals that you have.
But when I need something, perhaps a little bit more powerful, when I actually need to browse the data and click on things and I use a Docker image that has the full backend for me. So a nice user interface. In that case, it is a Grafana LGTM stack on a Docker container. Not ready for production, so it’s not suitable for production. It’s really only for my day-to-day dev tasks. So those are the things that I bring as part of my picnic.
Colin Contreary: Nice, awesome. I love that. And for everyone here, if our panelists bring up tools or resources, in our follow up email, we will share all those links. So you’ll be able to check these out and play with them as well. Cool. Iris, would you like to go next? What is in your OTel picnic basket?
Iris Dyrmishi: A little bit of everything. I’m a little bit of a messy person. So when I think about making my OTel basket, I usually think in an organization-wide, because that’s kind of what my job has been for the past five, six years, always thinking about observability in terms of a huge organization. So I’d like to bring everything there. So for example, if someone is trying to introduce observability and bring a picnic basket, it’s like, okay, let’s start with logging and see how that goes.
I’ve learned that that’s a little bit dangerous because you introduce one of them and then everyone gets so obsessed with it they don’t like to try new things and then there you have tracing amazing nobody wants to use it anymore. So I tried to bring all the signals and I mean honestly everything that Jurasi was saying I was like yes me too me too the Collector yes it looks good to me the Grafana that’s basically how I would test everything, but the Collector is always a central one that can bring everything together.
Colin Contreary: Nice, awesome. And I know, Hazel, you are also a fan of all the signals all the time. So if you’d like to go next.
Hazel Weakly: Absolutely. As someone who chronically loves food, all the types of food, and really enjoys catering for a wide diverse of people who are allergic to everything for some reason, I like to bring a little bit of everything and make sure that we have all the bases covered. And so one of the things that’s really important for me there that I don’t see necessarily as much focus for infrastructure people is it’s really important for me that the culture it’s there people feel like they can try the new things out. It’s scary. You have a backlog. You have all this things you need to do. You have to press on and ship. Do you have time to try the new thing? And yes, you do. Yes, you should. But how do you get there? How do you get people ready to take that leap? And then when they can, how do you meet them where they’re at? How do you make it so easy to try it out, to experiment with it, to understand is this useful for me?
Can I play with it? I really like to start there and get there. And so that’s one of my favorite tools is can I build that easy on-ramp? Can I build that ability to understand? Can I build that culture of experimentation? And as I’m doing that, can I then take the cost observability and take the levers that leaders care about, bake that into how we do things from day one? And then you end up with this really nice situation where developers feel encouraged to try new things, and leaders are not stuck with massive sticker shock. And if they don’t have sticker shock, and if they’re seen from day one how observability provides value, everything else in there is very smooth surfing because you’ve already caught the best wave.
Colin Contreary: Nice, very smooth surfing. I like it. Hanson, how about you?
Hanson Ho: So when I think of bringing stuff to the beach, I always think about food. So a sandwich is what I would bring. In the context of mobile, an OTel sandwich, what folks normally instrument are telemetry about the app itself, how it’s performing. For an OTel mobile sandwich, that’s just the condiments. That’s your ketchup or mustard or mayo. But the meat of the sandwich is user behavior. What you want to know is understand what your user is doing with respect to how they’re using the app and whether they’re getting stuff done. The performance is the condiment that accents the user actions. So it’s there, it’s necessary, but really it’s about to highlight what the users are doing and have performance linked directly to it. Of course, you need bread, what’s bread in an OTel sandwich, but the context and metadata. That allows you to slice and dice. And it’s not a sandwich without it. You can’t have just meat and condiments. So whether it’s gluten-free bread, whether it’s like, know, regular bread with gluten, it has to be there. Something has to kind of make it all tie together. And that’s context. And that’s everything around it. And with that, you get a really delicious OTel sandwich that is nutritious and makes you understand things, like how hunger doesn’t feel so bad.
Colin Contreary: I love it. You’ve just made me hungry, Hanson.
Juraci Paixão Kröhling: I’m hungry as well.
Hazel Weakly: I do have a question for Hanson actually. When you’re thinking of the condiments, one thing that’s important for people in the US and nowhere else in the world is mayonnaise. Mayonnaise is like the ultimate white people food because you just grab it in the store, and if you go outside of the US, it’s in the American aisle next to, like, the fake cheese. What is the mayonnaise of OTel?
Hanson Ho: Of OTel? Well, I can say what the mayonnaise of mobile telemetry is, which are crashes. It’s the one that’s ubiquitous because it’s easy to get. It’s everywhere, but it’s kind of useless unless you actually do something with it. So that’s, like, a log. If you use an OTel log and you just kind of like don’t put structure around it and just kind of like just keep gobs and gobs of log, it’s just going to clog up your arteries and it’s going to make your whole sandwich disgusting.
So would say logs, or rather unstructured logs, is the mayonnaise of OTel. And for mobile, that’s crashes.
Colin Contreary: Wow, it’s so interesting that you brought that up, Hanson, because one of the questions that was submitted was about mobile app crashes. So why don’t we dig into that right now? We have a question from Victoria. It’s, “How do you use OpenTelemetry for mobile crash data? We need to send lots of context, a structured exception, and some debug metadata, but there are no fields for these. It seems OTel is more suitable for backend telemetry.”
Hanson Ho: There are fields, they’re called attributes, and you can stick anything you want there in terms of context or metadata or additional information. What you have, what you want, is structure though. You don’t want to put all that stuff in the body and say, hey, parse it in order to actually extract value. Attributes are there for the reasons that was stated. So they exist, you just put it there. And one day, we’ll have a semantic convention when I submit it or somebody else does. So we’ll get there, we’ll get there.
Colin Contreary: Yeah, and you’re referring to a semantic convention for an actual crash, which does not exist yet in OTel.
Hanson Ho: Yeah. Yes. And there’s an asterisk around the word “crash” because it means a whole lot of different things if you kind of dig down to it, it’s different, different topic for a different, webinar.
Colin Contreary: Gotcha.
Hazel Weakly: I can actually totally understand what Victoria is coming from and what they’re saying when it comes to the backend telemetry aspect. Because if you look at the history of OpenTelemetry, it absolutely was designed for the backend. It was designed for microservices and specifically for microservices with manual instrumentation. And the manual instrumentation and the depth of the call chain typically did not tend to be more than three levels deep.
And so you’re seeing a lot of friction currently, and mobile, for example, saying, we need to be able to send things in the shape of the OpenTelemetry, you know, the spans and the traces. Really tricky. It’s really tricky to reason about and Embrace actually has to do a lot of interesting things in order to bridge the gap between the data model that OpenTelemetry wants and the data model that works best for applications.
Internet of Things is also encountering that. And it also turns out that we’re seeing the same types of problems come up with streaming applications versus batch applications versus serverless versus different models and contexts. When it’s not a microservice or when it’s not a REST API, you’re running into these little gotchas, but they’re not inherent as a limitation. They’re just things that we will get into and things we’ll be able to address.
And we’re already starting to address it with some of the favorite products that I’m looking at, like the [Apache] Arrow integration for OpenTelemetry and OTel Weaver. So Weaver, for example, is how you take the semantic conventions that Hanson talked about. You take the standard ones that exist, you add some that make sense for your application, and then you bundle the two together in a way that you can distribute it to the entire organization. And now you have a set of semantic conventions to match what vendors expect as well as what you and your company need.
Do you want mobile application crash semantics? You can put that in there. And then if you take that and combine that with something like Apache Arrow and the Arrow integration, you have the beginnings of a lakehouse architecture, which is one of my favorite ways to implement observability at scale. Then you can take the observability and the Collector, annotate it with a bunch of data, take extra data streams, put them all together, correlate them, mutate them, enrich them, and then send it to the backend of your favorite OpenTelemetry vendor, or you can send it to your favorite observability vendor, or maybe you can send it to other parts of the business that need it the most.
Colin Contreary: Wow, yes, indeed.
Hazel Weakly: And I’m done interrupting now.
Colin Contreary: That’s all right. I did want to circle back though because Iris, both you and Hazel talked about, you know, all the signals, like use everything you can. And then Hazel, you talked about, you know, be cost-conscious, make sure you’re delivering value, and not just racking up a bill. I know, Juraci, I know you’ve written about and you talked about this concept of purposeful instrumentation. So like making sure that the instrumentation is not just excessive or not useful. Could you chime in a bit about how people should be more purposeful in the instrumentation they do?
Juraci Paixão Kröhling: Yeah, of course. I think when we are instrumenting our applications, we are doing that for a reason. So we want to have information about our application when it crashes in case of mobile or when a user is having a specific error when it comes to back-end services. So we want to be able to tell the story of an error, the story of something that is wrong.
Of course, we are interested in the things that went right as well. So we want to do the RED dashboards. We want to understand the latencies and so on and so forth. But I think purposeful instrumentation is you looking at the instrumentation that you’re doing right now and making a decision. Am I instrumenting the right thing? Am I, do I actually need the client ID as part of my attributes for this metric? Probably not, right?
Metrics are aggregations. So perhaps I don’t need to aggregate at a client ID level. And that’s the kind of thinking that goes into purposeful instrumentation. You think about the scenarios where you might need that data and you select which signals and which attributes you actually need for that. So it’s not to say that people should only use manual instrumentation. This is totally not the point. The point is, if I’m using a library instrumentation for OTLP or HTTP server, it’s a conscious decision by me to look at all of the endpoints that that library is automatically instrumenting for me. So if I end up with telemetry for a health check, that’s on me. That’s my fault. And I should think about that before it actually goes into that part. So we own kind of the cost aspect. We, the people doing instrumentation – either developers or SREs or observability engineers.
So there are two types of instrumentation on two different audiences. Developers would do the manual instrumentation most of the time, or perhaps SRE, SRE by the book, or observability engineers, they would apply the auto instrumentation techniques or eBPF instrumentation and things like that. But all of that has to be purposeful. I have to be doing that for a specific reason. It has to be clear to me why.
If it’s not clear, I’m going to scream tomorrow about the costs of observability. And if I know why I’m doing that, then I know that there is a purpose for that. And I have to be able to measure the success of my instrumentation. So I think this is all part of the same story. I know we don’t have time for that. I get that people instrument all of the things all of the time because they don’t have time to think about the problems.
But I think nowadays, when we are talking about 10x developers and 10x tools and so on and so forth, I think there is a huge opportunity there for those tools to help us achieve purposeful instrumentation. So perhaps, yes, we accept everything at once, but then we use some tooling to go back to our stack and then fine tune the instrumentation based on what we actually need.
Colin Contreary: Nice. And I know Iris, you wanted to add a little something.
Iris Dyrmishi: Yes, because just hearing about purposeful instrumentation made me think about purposeful… Well, I’m saying it wrong, but you know what I mean, about the configuration as well, because when you are instrumenting the data, yeah, it’s very important to know what you want and what not. But there is also another part of the configuration, which is the Collector. You can enrich your data in a million ways there, and sometimes you can go crazy. So you need to know the purpose of what you want, how you want to transform your data, what exactly you want to add or remove from your data. So there’s, like, the instrumentation, then the part of when it goes into the OTel Collector pipelines and, of course, in the backend.
Colin Contreary: Go ahead, Hanson. I was just going to queue you up.
Hanson Ho: Sorry, I was gonna add to the whole cost and overhead bit. So certainly people talk about costs a lot of times to think about storage and processing in the backend, but on mobile, the cost is also in the collection. So even if you’re like, yeah, I got some sampling going on, tail sampling. Well, anytime you collect data, it is costly on Android depending on where you do it. Not just Android, too. iOS and other mobile devices just because they sometimes are 10 years old. Have you profiled your Android Go device lately? And if you have, you should take a look at how long it takes to record a trace and do stuff. And if you do it in the wrong thread, it could actually bring overhead that makes your performance worse. So be careful what you do. Do it purposefully and do it understanding what the cost is to your users, your end users, not how much you’re paying for Amazon bills.
How much is it impacting the app itself on a mobile that is extremely important?
Hazel Weakly: One of the things that really reminds me of is I’ve seen the user research on, for example, for Amazon, every millisecond that you have on the loading time of the page is millions of dollars. For Google, every time that you hit the search query, every millisecond costs a lot. And it’s not that that’s not the case for mobile. It’s that nobody measures that, so they don’t see the business impact.
And so one of things that I think about so often when it comes to cost and so often when it comes to understanding the system is that nobody really complains about the cost of business analytics or business intelligence tooling. It costs a lot, you could complain about it a little bit, but it’s so directly correlated to the value that you get out of it, to the ability to understand what the business needs and how to go from there, that it’s a worthwhile investment.
And so I don’t think of cost optimization, I think of strategic investment. It’s not about making the cost go down, it’s about spending on the right places. If you need to sink an entire quarter of engineering time into making the mobile startup time one millisecond faster, you can do that. Sometimes it doesn’t make sense, sometimes it does. For example, Uber, when they were launching and scaling their application, found out that they needed to take the application size and keep it under 100 megabytes. And the reason for that is because at the time, 100 megabytes was the max size you could download over Wi-Fi, or actually over mobile data. And one of the biggest use cases of signups is people being at the airport, landing separate, and going, oh no, how do I get to… And you could see in the revenue, boom, this massive cliff of dropping the second they went over that 100 megabytes.
So they said, crap, we gotta undo like the last week of deployments. And then we need to go talk to Apple and we need to say, hey, can you increase this limit? We’re running into this. And Apple said no. And then Uber said, but really can you? And so they spent about six months going back and forth on that. But in the meantime, they had that observability, they had that ability to understand that this is in fact a “something.” A single line of code might push you over that 100 megabyte limit. And that 100 megabyte limit might be the difference between millions of dollars, thousands of signups, or putting the application where it needs to be in the moment that you need it. You really have to think about that. And if you aren’t measuring, you’re not seeing. And if you’re not seeing and you’re not being able to analyze it, you’re not able to strategically invest where you need to.
Everybody talks about the roadmap. Everybody talks about adding the right things on your roadmap. How about taking the right things off of it? How about prioritizing the right things on it? You need the data for that.
Hanson Ho: Yeah, it’s interesting you bring up Uber, Hazel, because a company like Uber, where their competitors are basically offering the same thing. If your app is slow and people think, man, I can’t use this, it’s too slow. We’ll just switch to some other app and maybe the, maybe Lyft, maybe Waymo, maybe whatever it is. And you lose business right there and then. And you know, if you’re not accounting for that in your mobile performance and how it affects the bottom line like that, then well, you’re probably missing a big chunk of data potentially.
Hazel Weakly: So, Juraci, I cut you off by mistake. You were gonna say something. Do you remember when it was?
Juraci Paixão Kröhling: Yeah, I do. Well, it goes back to one of the things that Hanson said. So Hanson asked, when was the last time that you profiled your app? And I think the same question can be made to the backend services. So when was the last time that you profiled your backend services? And the point back there was it’s easy to collect on the backend and filter at the Collector side.
And I’d argue that the Collector is a stopgap solution. You should definitely do a tail sampling. You should definitely do PII cleanup at the Collector. But you are still collecting. You are still at SDK, at your application, you are still processing. You have processing cycles, creating that data, placing it in memory, queuing up, and exporting that data somewhere. You have traffic between those two services. You have network. So go back there and clean up the data at the source. If you have the chance, not only at the mobile application, because it is important to your users, but also on your microservices. They might be micro, but they are using up resources as well. So do care about your AWS bill that Hanson told you not to.
Hazel Weakly: So this actually is a really great point. This is why I recommend an unusual Collector architecture that I don’t see a lot of people talk about. If you’re running a Kubernetes cluster or you’re running essentially a distributed set of services or something in the backend, what I recommend is that at the node level or at the machine level, you have a Collector running per node. That Collector is what everything goes to.
That Collector is responsible for PII cleanup. It’s responsible for data sanitization. It’s responsible for head sampling. That Collector then forwards everything into the cluster-wide Collector. The cluster-wide Collector is responsible for the tail sampling. And the cluster-wide Collector actually sends everything into an S3 backend or into an object store or something of some sort so that you can sort of diff your data before all the sampling and after.
And so you can understand, am I losing data when I’m sampling it? Can I crank up the amount of sampling that I’m doing? Can I think about that? And when you have that data and you can analyze it, you can then take the head sampling information and push that to the node. When you test that and make sure that it works and you’re not losing anything important, then you can take the head sampling because you’ve separated it out very cleanly. The head sampling can then be pushed, just like Juraci said, into the code base where it belongs. And so it becomes almost a staging level where you’re saying, “Hey, how much can I shave off of my OpenTelemetry data, off of my telemetry, and my signals in general? What can I not send?” And then you can stage that. You can see it. You can test it out in feature flags, and then you can present it in application and just not even send the data in the first place. So over time, you’re taking the configuration of the nodes, adding stuff to it and then removing it, adding stuff to it and removing it. And every time you remove it, you go, “Wow, that’s cost saving. That’s performance improvement. That’s enhancement. I can track that almost by PR, which is super easy for engineering leaders to say, look at every single one of these PRs, that’s money saved. That’s network, you know, egress fees. That is my NAT gateway shenanigans, all these other things.
The tail sampling into the before and after for that S3 bucket. You can analyze things, can look at it and you can say, “Oh, hey, look at this. We went from, you know, a terabyte a day worth of data to 10 gigabytes a day worth of data. And we didn’t lose anything. Or, you know, we lost some things, but we have P, you know, five nines worth of queries able to be successfully, well, whatever matters for you. They can show that. If you accidentally over sample, you can immediately identify that by being able to do external queries whenever something fails, like an alert triggers and you can’t find the data. You can do an external table query. You can find and you go, whoops, we oversampled. We need to have that architecture in order to make that happen. So that is a great, great point. Thanks for bringing that up. That is why I recommend that. And it has to do with being able to push things strategically to where they belong.
Colin Contreary: Nice, that was awesome Hazel. We kind of, like, worked our way backwards into our next discussion topic, so we’ve already gotten into this, but let’s move into that now. It’s how can engineering teams get that sweet OTel tan? So what are some helpful suggestions for organizations that are starting, scaling, or maintaining their observability systems? One example could be setting up things like that to help reduce costs and things like that. But Hazel, we kind of started with you. I wonder if we can kick it over to Iris to start with this one.
Iris Dyrmishi: This is going to take us forever to discuss because every phase of the OTel tan has its own advice, let’s say, right? But since we went a little bit on the architecture and when you actually have a OTel established and you are wanting to improve or to introduce an architecture that actually is going to save you money and get you that meaningful data, I want to start from the very, very beginning for people that are wanting to try OTel because it’s a lot of conversations that I’ve had. How do we actually get to it? How do we go to that OTel sun to get some of that sweet tan? And my first advice for it would be to start small and to show value. So I know of a lot of engineering organizations that are skeptics of OpenTelemetry, even though at this point it’s backed up by so many of the biggest observability vendors. It’s one of the most contributed projects and it’s becoming one of the biggest projects right now under CNCF. Still, there are some that would not like to use OpenTelemetry. So usually, my advice is to show value. You go and you see your observability platform. There will always be one of those telemetry signals that you have not paid attention to for the longest time. And I can bet you it’s going to be tracing. Everywhere that I’ve spoken to people, it’s always tracing that’s the forgotten child.
Okay, say OpenTelemetry-tracing together. Let me show the value to my company. That’s how you’re going to introduce it. So you do your magic there. You show how good the data is going to be, how easy the transition if you’re using another technology and there you go. And then you start with the other telemetry signals depending on the priority that you have. It’s something that shouldn’t be rushed because it goes both ways. Some are skeptics and some are, like, “OpenTelemetry the best thing that has ever happened! Let’s migrate to it immediately.” And in the process things are breaking, dashboards are not working, users are not happy, so in big organizations it can cause that thing. “Okay, we introduced OTel but we didn’t actually fix our problems.” So do not rush it. Release slowly. Use the tools and learn the tools very well. We’ve already mentioned so many good things that can be done and so many different ways to implement it. So it’s important to understand that before you introduce it to your organization. And I think, I mean, so I don’t speak about it for the next 30 minutes. That’s the basis or the beginning of getting the tan.
Colin Contreary: Nice. Yeah, Hansen, would you like to chime in next?
Hanson Ho: Yeah. So I think before you start with any lines of code or anything technical, you’ve got to align the organization, especially the incentives in each stakeholder. If you have your CEO, your product people say, “Hey, this is great. It sounds great.” You got to make sure the mobile team is up for it. Do they want to actually own this? Do they want to find additional problems with their app that they’re already struggling to fix issues with?
So if your mobile team doesn’t wanna do it, you can’t really force them. I mean, you can, but there are ways for actual teams at the team level to do it. And if your team wants to do it, but there’s no support at the higher levels to identify which are important workflows, what KPIs they wanna actually measure, then what they get is just a bunch of data that doesn’t connect to anything useful. So unless everybody buys in, it’s gonna be very difficult to roll out successfully.
You can certainly get an implementation that has some data and that provides some value. But to truly leverage any of this stuff, everybody has to be bought in or at least not be resistant to it. It has to be okay or better, enthusiastic or I’m not gonna block it. So unless you find that fit in your organization, don’t even try because it’s just gonna be a waste of money.
Colin Contreary: Nice. And actually, before we move on to the next panelist answer, I wanted to give two quick things. So one, as a reminder, please use the Q&A feature to ask questions. We’d love to get more so we can answer them throughout the panel in addition to at the end. And the second is, we got a lot of questions in advance about the support in OTel for mobile. And so Hanson, you were just talking a bit about mobile. Can you share a bit about what is the current level of OTel support in mobile, and can people use the OTel Android and Swift SDKs?
Hanson Ho: Yes, I mean, it works, but it is not designed for it, shall we say, especially in the backend tooling and the Collector part. Traces work great. Spans work great if you’re thinking of modeling performance traces. But if you want to use that signal to do something that’s not strictly like a performance kind of view into a workflow, it becomes a bit challenging.
Similarly with logs as well. I would say we’re in the process of making things better. There’s a lot more activity, I think, over the last few months. Every time I say this, but every time there’s more. So we’re really building momentum, I think, in the mobile space, trying to take something that was designed for the backend to monitor backend devices, app performance, to something that is more user-centric, user-focused, to link it to performance for client applications.
So there’s some rough edges, but not unovercomeable rough edges. So we [Embrace] just started to create a Kotlin API for the tracing spec. And we hope to develop an SDK soon, as well as fill out the rest of the OTel APIs. Because, you know, folks on Kotlin Multiplatform, as well as just Android developers who don’t really know Java, really would like something that looks like it’s for them and built for them. And we’re hoping to do this in a way that’s not related to Embrace and just like have everybody be able to use it because I think we believe that if everybody uses this stuff, they’re going to demand better stuff. And I think everybody wins.
Hazel Weakly: So as a super, super quick sort of technical note on why telemetry is particularly hard for mobile applications and for frontend in general, what you’re seeing is really the friction between the data format and how you build that data format and build that data structure in the application. So for any event-style architecture or any “can be interrupted at any point”-type of application, you’re going to run into this issue. So React has this problem, anything mobile has this problem, anything that’s streaming or an interruptible type of function, a long batch process that could be interrupted, anything that is a distributed transaction, to use database language, is going to have this problem. And the reason for that is because you have “start span,” then everything needs to exist inside of there, and then you have this “end span,” and all of that has to exist.
When we write the actual application in the code, usually you’re writing, when this event happens, do things, add data wherever it needs to go, put it, and that doesn’t match the, how the data wants to be structured in the backend, but how the data is structured in the backend doesn’t have to be how it’s sent on the wire, and how it’s sent on the wire doesn’t have to be how you construct it. It’s just that currently all three of those things are the same and all of that evolution that Hanson’s talking about and all of the work that Embrace has done on the backend is on separating those three different things so that you can write the application in a way that makes sense, you can send the data in a way that makes sense, and you can ingest the data in a way that makes sense. So all three of those are evolving at a great pace. I’m very excited to see where they go. And currently that friction is going to be inherent for a little bit, but you can write the application, can write the infrastructure, you can write everything, and you can trust that you can ride the wave as everything starts to improve underneath you. And you can just take advantage of all those great improvements as you go. Looking forward to it.
Colin Contreary: Yeah, a lot of interesting developments definitely in OTel across all the different domains. So it’s a very exciting space. And yes, ride the wave, Hazel, we are excited to do that. Juraci, I don’t know if your headphones are failing or whatnot, we’re just making sure you can hear us because I was going to kick it to you. Everything working over there?
Juraci Paixão Kröhling: Yeah, yeah. Yeah, everything’s fine. I was just looking for a pen so that I could note the points that Hanson was making so that I remembered them.
Colin Contreary: I wanna kick it to you about your tips and helpful suggestions for people to get that sweet OTel tan.
Juraci Paixão Kröhling: Yeah, and I think quite a lot has been said already. So a lot of my points would be what Iris said. I mean, it’s really about starting small and so on. But I think there are a few other things that we haven’t spoken before here, and they are very important. So the first one is going back to the purposeful, like what do I want to extract from OpenTelemetry, from OTel? OTel is huge. It’s a huge project. There are so many things to OpenTelemetry. There are like 13 APIs and SDKs. There is a bunch of protocols. There is OTLP, there is OpAMP, but there is a bunch of specifications, like the API SDK specification, there is the semantic conventions, and so on and so forth. So all of them, they follow a specific theme, a specific idea, and that is they help you be unlocked from your vendors.
So if you want to instrument your applications, and we are in the year 2002, you have only a few options. You have to pick a vendor and you have to instrument your applications using that specific vendor’s API. And if that vendor bumps the price three times next year when you’re up for renewal, you have a choice to make. Do I pay this ransom, or do I rip it out and replace it with another proprietary API? And this is one of the aspects that OpenTelemetry can help. Now, if that’s a pain for you, if you’ve been burned before, then you give so much value to that. So you appreciate this side of OpenTelemetry.
Now, if you are OK with the instrumentation that you have, but you are trying to save yourself from future pain by using a Collector in the middle, that’s fine. A Collector can be the place that frees you or that softens the lock-in between you and your vendor. So you can stream just proprietary data, convert into OpenTelemetry data, and send to your backend, to another backend, to another vendor if you want. Now, perhaps it is not on the Collector side. Perhaps you care about the protocol. So the OTLP protocol, you don’t care about the agent that is running or the API instrumentation. If they all speak OTLP, you are fine. So the vendor neutrality aspect of OpenTelemetry is what is most enticing to OTel. So if that’s important to you, that’s a why. So having this why at the very beginning is very important.
So Hanson said something that – that’s why I got my pen here – because he said something like, the senior level, senior leadership team cannot or cannot impose the usage of OpenTelemetry. I mean, they can, but you know, that’s exactly what happened to a company. And I was talking to this person last Friday, and he was saying, at one company that I was before, they mandated the usage of tracing at the top level. It came from top down. Of course, it didn’t work. When it’s mandated and when people don’t know why, when it’s only you have to do that, it’s not going to be successful. You have to know why. Definitely start small. If you have a pain, if you have a problem, I was a QE, a quality engineer in the past. One of my techniques in dealing with a new code base was, “Where is it burning?” I mean, where do I find most of the bugs? And that’s where I start. That’s where I add more unit tests. That’s where I increase quality. The same with observability, right? So, what are the services that are causing the most alerts in the middle of the night for me? So that’s where I can get started. That’s where I add more instrumentation. That’s where I start observing. You’re not gonna observe your whole fleet of 26,000 microservices in one week, right? It’s not gonna happen.
Take the ones that are small enough and are noisy enough and just do it. And I think that the final realization is that devs are not observability engineers, right? We are here breathing OpenTelemetry every day, the whole day. We forget that developers, they don’t care about security. They don’t care about observability. I mean, sure, they care, but they don’t, right?
And I think it’s our role as observability engineers to understand that and to not assume that they can write a PromQL query spelled backwards just like we can. We have to hold their hands. We have to help them understand what is a rate in Prometheus? What is a histogram? What is the difference between a native histogram and a classic histogram? Or what is really a histogram? What is a P99 and so on?
So we have to assume that they don’t care and they don’t know about that. And we have to help them. And we don’t help them by teaching them PromQL. That’s not the point. The point is, do you know how long your users are waiting for an answer from your service and how much of that answer is caused by your downstream services? So that’s why they care. And I think if you have this mindset that, you know, devs are not observability engineers, I have to bring them answers with value, then you’re going to have a successful implementation of OpenTelemetry.
Colin Contreary: Nice. And Juraci, you touched a little bit on this. You were talking about the vendor-agnostic portion as well. And we have a question about that. So I’d love to pull that up and answer that now. Here’s the question. “You’ve spoken a lot about an engineering-centric justification for OpenTelemetry adoption. Outside of engineering teams, the push seems to be, OTel is vendor agnostic. How does that weigh into the decision process for, ‘To OTel or not to OTel?’ That is the question, which, we’re adding some Shakespeare to this. I wonder, well, maybe we can have Iris kick this off and then we can all chime in as well.
Iris Dyrmishi: Yeah, I’ll just add to what Juraci said. Outside of engineering, you will not find the enthusiastic, this new technology that’s going to bring so much value, it’s going to make our life easier. It’s going to be all about money and the bills. That’s at least how I see it. So, yes, I think it’s the biggest justification that you can give outside the engineering team, mostly the senior leadership about why you want to use OpenTelemetry. And I usually do that by giving some examples. The first one was exactly what Juraci said. You have a vendor, everything is working great, but then they’re… you’re not compatible financially anymore.
You will have to pay a million dollar bill. One million is a little, but several million dollar bills. And it’s like a ransom that you cannot pay, or you do not think that it has enough value. Or this vendor is just not progressing like the rest of the other vendors, or it’s not having the features that you want. So either you will have to pay this crazy amount of money, or you will have to migrate to yet another vendor. And imagine the workforce that it goes to that and the changes and the months and months that it’s going to take. So this makes for a great case to leadership about going to a vendor-neutral, agnostic solution because there is a very big chance that if you are depending on another company, they will move forward and produce things that do not fit your use case anymore.
Or they will lag behind and you will always be dependent on them and that’s not great. Meanwhile, if you’re using OpenTelemetry or another vendor-agnostic solution, you’re always in control of your data. You have the freedom to do whatever you want basically and to find the solutions, even build them yourself if you feel like it at the end of the day.
Colin Contreary: Nice. Thank you, Iris. Did anyone else have anything to chime in on that question? If not, we can move on to our next topic.
Hazel Weakly: So I do have things. I will keep it brief. I think historically people talked about the engineering-centric justification for OpenTelemetry a lot, and you got a lot of engineering excitement. And then the business said, “Well, this is an expensive migration. The vendors may be more expensive, maybe less expensive. We have a lot of things tied to these observability kind of vendors. Why migrate? Or why pay this or why, especially as costs went way up, why are we doing this?”
And so it’s not that we don’t have engineering-centric justifications, it’s that a lot of the energy right now is focused on keeping it around and continuing to introduce it. And the biggest blocker for that is currently the economics of it. So that’s what we’re focusing on. But historically, a lot of the justification for OpenTelemetry has been around answering unknown unknowns, which is something that, can you without re-instrumenting the application, without going, I need that, nevermind, or going back in time to fix something, can you answer a new question during an incident? The way I like to think about that is, can you learn from your system over time? And if I think of team and organizational dynamics and how humans think and learn, it turns out that humans don’t learn in terms of sharing knowledge. We learn in terms of sharing process.
And so originally what was happening is we would share knowledge and you would have these signals and data from the older styles of like, here’s just the metrics, here’s just the signal, here’s just the, and we weren’t sharing the process, we were sharing, here’s the intuition, here’s the knowledge. When this alert goes off, it means this.
When this does a certain thing, it means that, and that doesn’t scale. What I want to do is, I want to share a process. Here’s how to find out. Here’s how to understand. Here’s how to dig in. Here’s how to slice and dice and think about things. Here’s how to problem-solve. If I can share that process, you can take that and you can do that with any of the systems that you build, not just the ones that you understand. And so when something breaks, you can come in and go, I know how to figure out what’s going on. I know how to learn. I know how to investigate. You went from pieces of knowledge and memorizing being that encyclopedia to, okay, here’s this process of learning and sharing and understanding and digging in. I’m going to do that. How do I debug at scale?
Colin Contreary: Nice. And I was going to say, Hazel. I was going to mention you wrote a great piece talking about this foregoing of the process, but it was specifically about how we’re building AI tooling incorrectly. So we don’t need to make this become a whole AI thing, but we can include that in the resources if people want to read that afterwards. Unless you have a very short AI thing, but maybe we should go into the next segment because we’re running out of time. Our third segment we’re going to do. We’re calling it, “Beach, please.” We’re on a beach and it’s time, this segment is called “Beach, please” because we’re looking at OTel and we want to share where it’s leaving us just a little bit sunburned and where we’d like to see it make a little bit of progress.
So I will kick it first to Hansen. Hansen, what is your “Beach, please” about OTel?
Hanson Ho: “Beach, please” decouple the span from performance tracing in terms of use cases. Having all the tooling in the backend assume a span is modeling performance tracing, it hampers how it could be used. I wish there were alternatives to interpret this information, which is effectively two timestamps, an outcome, and some attributes. There are many other ways of using this information, and making fewer assumptions or, rather, having the ability to make a different assumption, would be extremely useful for open source backend tooling Collectors to help use this data in a more diverse way.
Colin Contreary: Nice, thank you, Hanson. Iris, what is your “Beach, please?”
Iris Dyrmishi: “Beach, please,” can we get some more love for frontend and web observability? Yeah, of course, backend observability is very well established now. I mean, of course, there is still work in progress, but it feels like frontend is the forgotten child. And a lot of companies are using more the proprietary technologies that the vendors are offering right now. So it goes kind of against this whole vendor-neutral thing, but that’s a tooling that we’re having. So, I’d love to see some more, some more love there, some more action. I’d love to be there to try it and to implement it. Why not?
Colin Contreary: Nice. Juraci, what is your “Beach, please?”
Juraci Paixão Kröhling: Yeah, before doing that, a huge plus one to what Iris said. And I just wanted to make a note that there is a Browser SIG proposal that was just opened, I think this week, really. So if you are interested in browser instrumentation, in client instrumentation, make sure to join that either as a user or if you are a vendor, just come and help us build it.
Because it’s a common theme here that people seem to agree that backend observability is quite different than client instrumentation. So help us figure that out, please. And risking the mispronunciation of this word, because I’m Brazilian, I cannot differentiate between the two of them. “Beach, please” Collector v1, right? I’m waiting for the Collector v1 for a long time now. I know that as a community, we are trying to get it out very, very soon. And I cannot, you know, I’m really eager to see v1 out of the door. Collector is effectively stable. People are using the Collector in production in different ways and different size of installation. So it is stable. We just need, you know, to really tell people what is and what is not, like what they should and what they should not use. I think they’re just waiting for for us, the people behind the Collector to tell them what is right and what is not right. And I think a couple of semantic conventions, they also left a couple of us a little bit sunburned, especially HTTP semantic conventions. And the third one is auto-instrumentation. So much telemetry for so low value. Again, purposeful instrumentation, folks. Think about what you auto-instrument as well.
Colin Contreary: Nice, thank you. And Hazel, what is your “Beach, please” about OTel?
Hazel Weakly: “Beach, please,” what do you mean by spending 20% of our entire infrastructure budget on something that only one specialized team can query, understand, and roll out? I would rather light my money on fire, it would be a better return on investment. And no, “Just let the AI do the problem-solving so that our engineers can remain unable to be effective, unable to understand the systems, and still have no clue what’s going on,” is not the answer.
Colin Contreary: Nice, very good. We are coming up at the end of the hour. I think we only have time for probably one other audience question, if we keep it brief. So we’ll see what we can do. But we do have one someone submitted. It’s, “Do you think there is enough tooling for testing OpenTelemetry Collector configurations? For example, ensuring that transformations are working properly.” I’d love to send that to you, Juraci, if you have some help with them.
Juraci Paixão Kröhling: Yeah, I think it ties back to the Collector v1 kind of argument, right? I mean, definitely we need more tooling. No, we don’t have enough of them to test changes to the Collector pipeline, or to the telemetry pipeline for that matter. It is a common problem that I hear people saying, like, “How do I ensure that I change this configuration here and I still have observability if my systems go down?” We don’t have that right now. And I think, I truly believe that the OpenTelemetry community deserves an open source tool that will help them have control over their telemetry pipelines end to end.
Colin Contreary: Awesome.
Hazel Weakly: I would add on top of that. And I would say that one thing that frustrates me about OpenTelemetry is when it comes to this, we’re approaching it as if it’s a completely new or brand new problem set. But the data engineering, data science, data infrastructure people have been solving all of these problems for decades. And they are decades ahead of us in this. If we were to just for a brief moment, stop reinventing the wheel and the entire universe and go, “What can we learn from how to think about schema evolution, upgrading databases, upgrading ingestion, upgrading all these things, modifying them, observing them, and watching the watchers?” Database people, data engineering people, data infrastructure people, they have had to figure all these out for decades. They have actually figured some of these things out. They’ve even built some tools.
And so it’s, you know, yes, of course we do need better tools. Juraci actually pointed that out. But it’s almost… we need to approach it in the right way. Yeah, we need better tools, but writing them from scratch is not the way to do it. If we do that, it’s going to take another 50 years to catch up to where data engineering already is. Maybe, just maybe, we learn from them, build things to interoperate together, and actually start focusing on solving the same problems with them, together, so that everybody can benefit.
Colin Contreary: Nice. Thank you so much, Hazel. Yes, that’s a great point. And we are running out of time. So that’s actually all the time we have for questions. And unfortunately, all the time we have for this wonderful discussion. I want to give a big, big thank you to this wonderful panel. Thank you all for being here. You in attendance, thank you for being here asking such wonderful questions. Thank you for learning a bit more about how to catch some sweet ob-surf-ability waves with us. People like face palming, right? Yeah, it happens.
Like I said before, we’ll send a follow-up email with the on-demand version in case you’d like to watch or share with your team. We will include all the links to the resources and tools our panelists mentioned. And feel free to respond to that email with feedback so we can improve these types of panels in the future. So once again, I want to say thank you, thank you, thank you to this awesome panel. Thank you everyone for being here and I hope you have a wonderful day and an even more fantastic summer that’s coming up soon. So, thank you everyone.
Get started today with 1 million free user sessions.
Get started free