

Note: This piece is about how to finally solve ANRs using higher-fidelity data from Embrace (YC S19) as opposed to using existing solutions, like Firebase, for Android mobile applications.
About Embrace: I founded Embrace to be the best-in-class observability and data platform for the modern mobile team. Teams add our SDK into their mobile applications to collect, identify, and solve every issue that results in poor user experiences. The key differentiator is that we collect the technical details and user behavioral actions of every single session, which is required because of the infinite cardinality of user, environmental, and device variability. For reference, our previous launch is here: https://news.ycombinator.com/item?id=20677403.
This post is about a particularly tricky class of bugs: the infamous Application Not Responding errors on Android.
What is an Application Not Responding?
For those not familiar with Android development, Application Not Responding (ANR) is a type of error on Android that predominantly occurs when the main thread of the application is blocked for a minimum of 5 seconds, upon which the user is prompted to terminate the app. This means a user is unable to take action in an app (e.g. scroll, tap, etc.).
I was a founder of Scopely, a mobile games company that created games like Walking Dead, Star Trek, and Scrabble. When playing our games, I would experience “freezes” and my players would constantly complain of “crashes”. These are broken experiences that stop the user from progressing and enjoying the game. But these were not normal crashes that show up in your crash reporter. It turns out these errors that were frustrating our users were actually ANRs.
The difference between a crash and an ANR is that a crash is a code exception whereas an ANR is an ongoing state of nonresponsiveness. So when a crash happens, the app itself terminates. When an ANR happens, the user simply cannot do anything in the app and will eventually force quit it.
The way mobile developers traditionally investigate ANRs is through the Google Play Console, which is a platform for publishing mobile apps. However, there are two main problems with how it handles ANRs:
- It severely underreports them
- It doesn’t provide sufficient data to solve them
How Google Play Console underreports ANRs
Google only reports an ANR when the user is prompted with a termination dialog, which only occurs when the main thread has been blocked for at least 5 seconds. For users that force quit and uninstall frozen apps before the dialog appears, mobile teams have little visibility into what the cause was.
How Google Play Console does not provide sufficient data to solve ANRs
Google only provides you with a single stack trace taken when the ANR dialog is displayed to a user. But whatever triggered the ANR happened at least 5 seconds ago. Ideally, you want to know what the main thread was doing right when it became blocked.
Embrace’s approach to solving ANRs
Our approach is to start capturing stack trace information as soon as the main thread is blocked for 1 second. We accomplish this by pinging the main thread every second. If we don’t get a response, we collect traces every 100ms until either the app recovers, the user force quits, or the ANR dialog appears.
Google could collect this data as well, but they do not. We collect it as part of our SDK that you integrate into your app. You might be wondering if there are associated performance hits for this additional collection. We all know there’s no free lunch, so there’s certainly a bit of overhead in us capturing this data. However, we’ve focused on making this as efficient as possible. For example, we only capture the main thread’s stack and not those of the potentially 100s of other threads running. Also, we focus on the data capture during the ANR, deferring processing until after the ANR is done or the user exits the app.
These additional stack traces provide insight into what code your app was executing and how that evolved during the duration of the ANR. This allows you to better pinpoint the root cause.
Grouping ANRs has always been a challenge because the time that stack traces are captured is, given how operating systems function, imprecise. What happens is you end up with a number of ANRs that touch similar parts of the code, but the stack traces differ enough that no root cause is immediately clear. In aggregate, these “separate” ANRs would point to the problem if they were better grouped.
One benefit of our approach is that we group by either where ANRs started or where they ended. We can also group based on the last N samples in an ANR interval, which allows us to look for commonality among different ANRs that would not be possible with just the final stack trace.
Using a flamegraph methodology to depict the ANR information helps uncover patterns that elude traditional list-based visualizations.
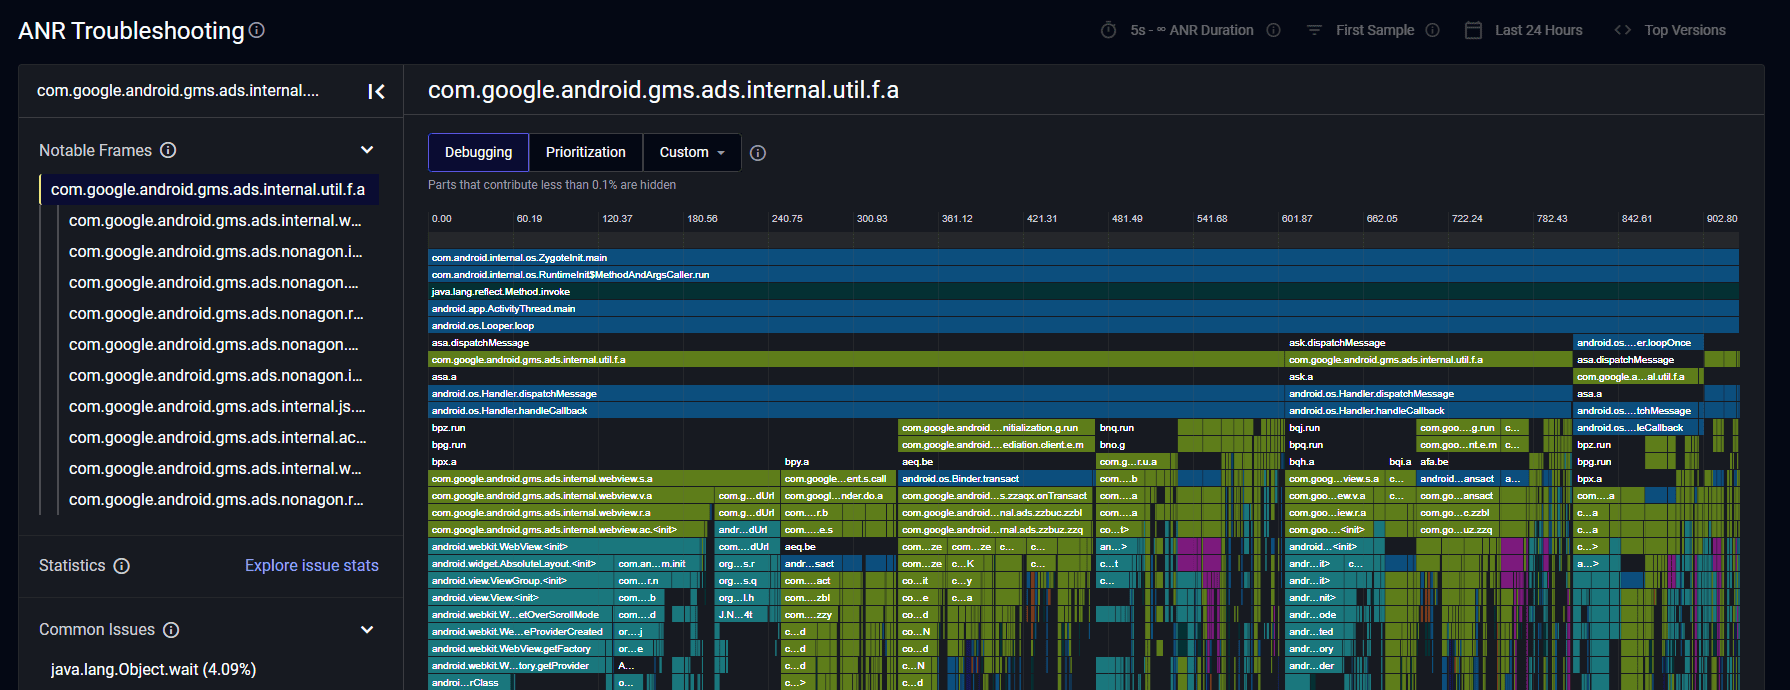
Flamegraphs have commonly been used to identify CPU usage from captured stack traces when profiling performance. We can use that same approach with ANRs, grouping the most common stack trace patterns together. Thus, we are not forced to pick a single line to group on, but rather can show which lines are frequently found together in stack traces, even if the lines that traditionally would have been grouped on are different.
How Embrace helps our customers
Here are a few examples of how we have helped our customers identify the source of ANRs.
- A F500 home improvement e-commerce app had a spike in ANRs in a new release. When inspecting the affected user sessions in the Embrace dashboard, they noticed these ANRs were happening at startup. Sure enough, their median startup time ballooned from 1.9s to 3.2s. The period affected by this bug saw a 13% decline in revenue. By looking at the first samples of the stack traces, they were able to identify the newly-introduced blocking code and put out a fix.
- A music streaming app with 10s of millions of DAU struggled with solving ANRs. The Google Play Console did not reveal any discernible patterns regarding the underlying root causes. We took the most common vendor SDKs in their ANRs, then created flamegraphs for each SDK. This surfaced individual method calls that were responsible for anywhere from 30% to 60% of all ANRs stemming from those SDKs. This allowed them to focus their attention on the paths leading up to these method calls to find a fix.
- A POS app for a large F500 restaurant chain improved their ANR session-free rate from 6% to 96%. Our dashboard revealed long-running tasks on the main thread happening across different activities throughout their app. They refactored their code to move these tasks to background threads and eliminated the freezes.
- On version release, a large text and calling app experienced a 30% spike in ANRs. The Google Play Console stack traces were of zero help. By analyzing the earlier-in-time stack traces that we provided, they identified and solved the issue.
Summing it all up
At Embrace, our mission is to provide mobile teams the data they need to optimize their mobile applications. For ANRs, we collect earlier, more actionable data than Google Play Console, which provides our customers many benefits. They can detect freezes that happen throughout the application and move blocking tasks from the main thread to improve user experiences. For freezes that the application cannot recover from, they receive stack traces during the entire ANR interval, which allows better grouping and a greater ability to solve them.
If you’d like to learn more about Embrace, you can check out our website!
Get started today with 1 million free user sessions.
Get started free