You might have noticed that crash logs generated from apps built with the “Debug” configuration are completely different from apps built for “Release”. Why is that? How do you make sense of them?
In this post, we’ll cover the following:
- Why do you get different crash logs when building for production?
- How do you locate dSYM files?
- How can you confirm you have the correct dSYM file?
- How can you collect and symbolicate crash logs manually?
- Is there an easier way to collect and symbolicate crash logs?
Why do you get different crash logs when building for production?
While the compiler is turning all your human readable source code into machine language, it also creates what’s known as the “Debug Symbols” or “dSYM” for short, which is all the information needed to translate memory addresses and machine code back into the original “human readable” state. The “Debug” scheme configuration stores this information directly onto the binary while the “Release” configuration strips it out in favor of reducing file size and also to make it way harder for third parties to reverse engineer your binaries.
How do you locate dSYM files?
In the (not so distant) past, if your app was “Bitcode enabled” you were able to just download the dSYM off the App Store by either going to iTunes connect or clicking the “download debug symbols” on the Organizer window on Xcode, but since Bitcode was deprecated in Xcode 14, this is no longer the case.
Nowadays, you’ll have to locate the symbols file from where the app was built to submit to the App Store. If you’re building the app on your computer, you should be able to just get the .xcarchive file, right click it, and go to “Show Package Contents”:
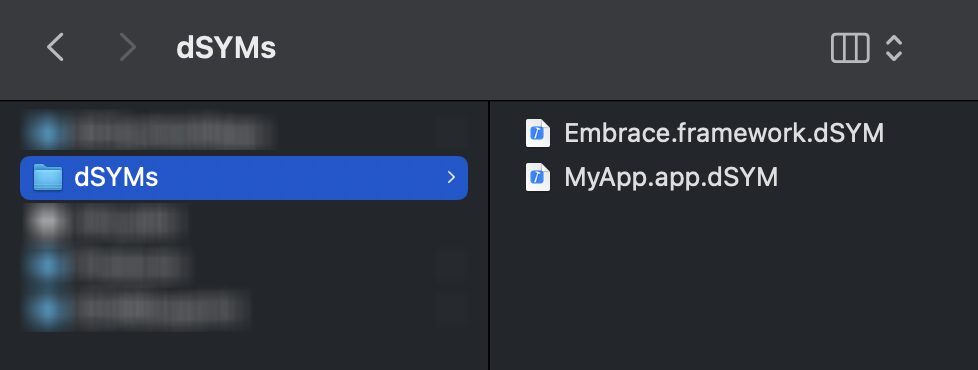
You should then see a folder named “dSYMs” that contains all the dSYMs for all your app binaries. That’s right, all the binaries on your app — including frameworks that are compiled along with your code—will contain their own dSYM file.
If your app was built using a CI system, you should look up where it stores the resulting product so you can find the dSYMs there.
How can you confirm you have the correct dSYM file?
The dSYM file, app binary, and crash logs it produces all should have the same UUID. This UUID is unique for each build of your app. If you already know the UUID of your crash log and are unsure what dSYM file is the correct one for that particular crash, you can open the terminal and go to the folder containing your dSYM file and run the following command:
$ dwarfdump –-uuid MyApp.app.dSYM/Contents/Resources/DWARF/MyApp
And compare the result with the UUID of the crash. Alternatively, you can check if the resulting UUID is included in the crash log by running this command on the terminal – this is located in the folder containing the crash log:
grep -o -i ‘YOUR-UUID-HERE’ MyApp.crash
If the UUID is found inside the crash log, you know you have the correct dSYM file in your hands.
How can you collect and symbolicate crash logs manually?
If your users opted in on sharing usage information with you, then you should be able to acquire crash logs generated by iOS on your “Crashes” tab on Xcode’s Organizer window (you need to be logged in to your iTunes connect account) or you can grab them directly from iTunes Connect.
After you get your hands on your crash logs, you can symbolicate them using Apple’s instructions.
Is there an easier way to collect and symbolicate crash logs?
Yes! You can make the process significantly easier by using third-party tools to handle both crash log collection and symbolication.
Embrace is a solution that makes the process much easier. In addition to automatically collecting app usage statistics, logs, and networking statistics, Embrace handles crash collecting and symbolication for you, providing highly accurate crash groupings, built-in intelligent scoring, and deep user context so you can deliver crash-free experiences to your users.
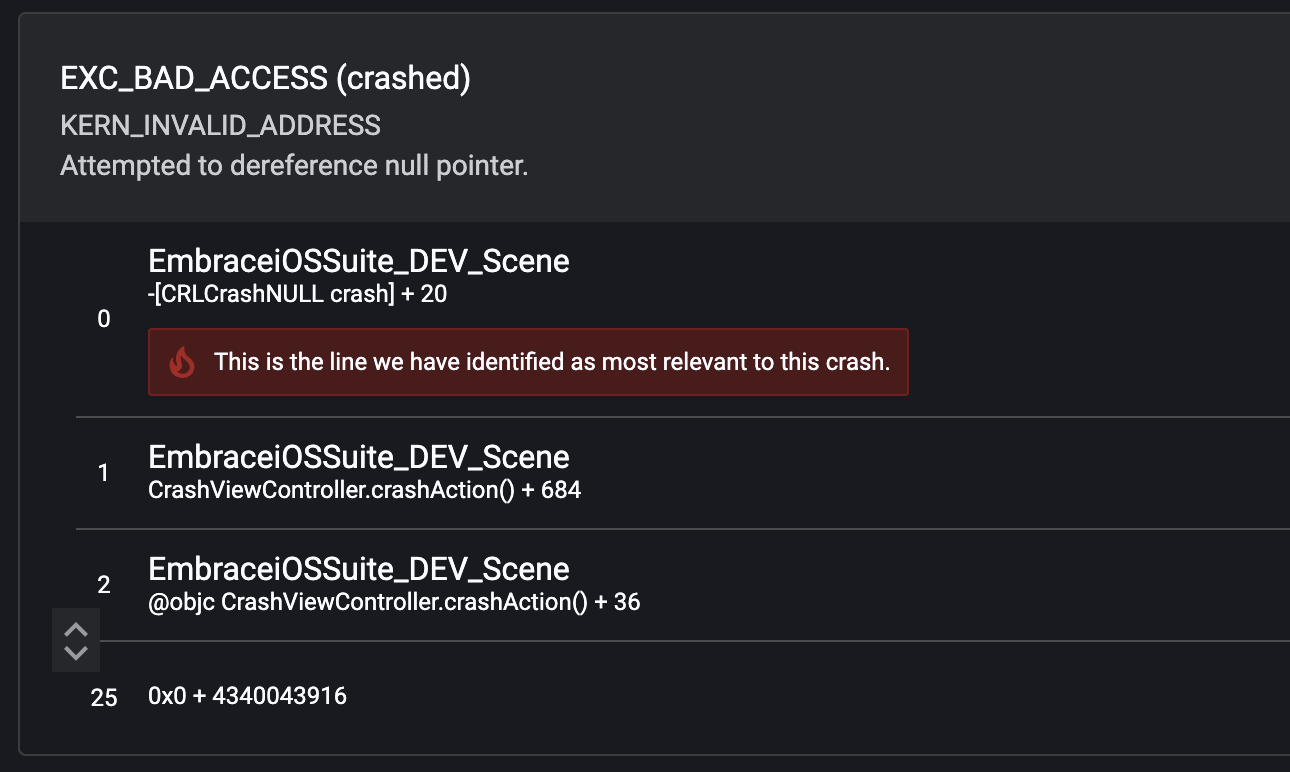
Here is a quick example of how Embrace analyzes and condenses your symbolicated stack traces to highlight the most relevant information.
All you need to do is integrate Embrace into your app and provide the dSYM files either manually or automatically using a provided script. That way, your dSYM files will be automatically uploaded every time you create a release version of your app on your computer.
Want to try it yourself? Explore Embrace today.


