performance monitoring

Embrace's latest upgrade to our performance tracing feature lets engineers see all the network requests that occur in a user flow as individual spans within a larger trace instance. Engineers can now better understand the temporal relationship between network activity and other events within a flow, leading to quicker insights and faster issue resolution.
Performance issues in mobile applications are often tied to network requests taking longer than they should, which is frequently beyond the control of mobile engineers. These delays can be caused by a variety of factors, including server-side issues, third-party tools, poor network conditions, or inefficient APIs. When debugging a specific flow, performance engineers struggle to find the root cause of prolonged requests.
Previously, to investigate the impact of network calls on a specific trace, users would have to navigate a cumbersome, multi-tool process. This disjointed approach makes it difficult to identify whether a performance issue is due to a slow network request or another part of the code in the mobile app, delaying resolution and complicating the debugging process.
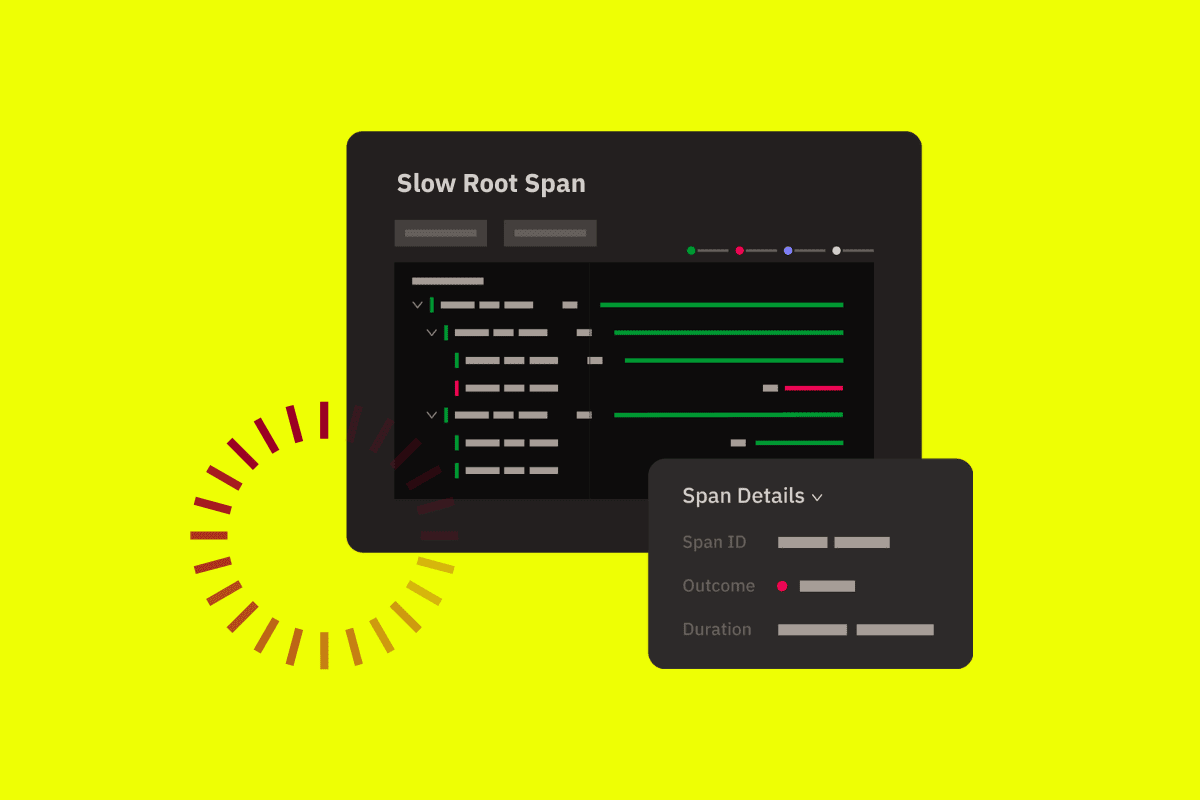
Now, with Embrace’s latest enhancement to our performance tracing feature, this limitation is a problem of the past. Network requests are now automatically included as spans within the larger trace of an end-to-end flow of application activity, and can be viewed within our UI as a list of requests that happen within the time frame of the entire trace. This means that all performance traces will display concurrent network requests as spans within their trace instances. This enhanced context helps users clearly understand the temporal relationship between network activity and other events, leading to quicker insights and faster issue resolution.
The inclusion of network spans alongside other spans in single trace instances also offers a comprehensive view of application performance. This unified view makes analysis of complex user flows more straightforward, eliminating the need to switch between different pages and tools and saving engineers both toil and time.

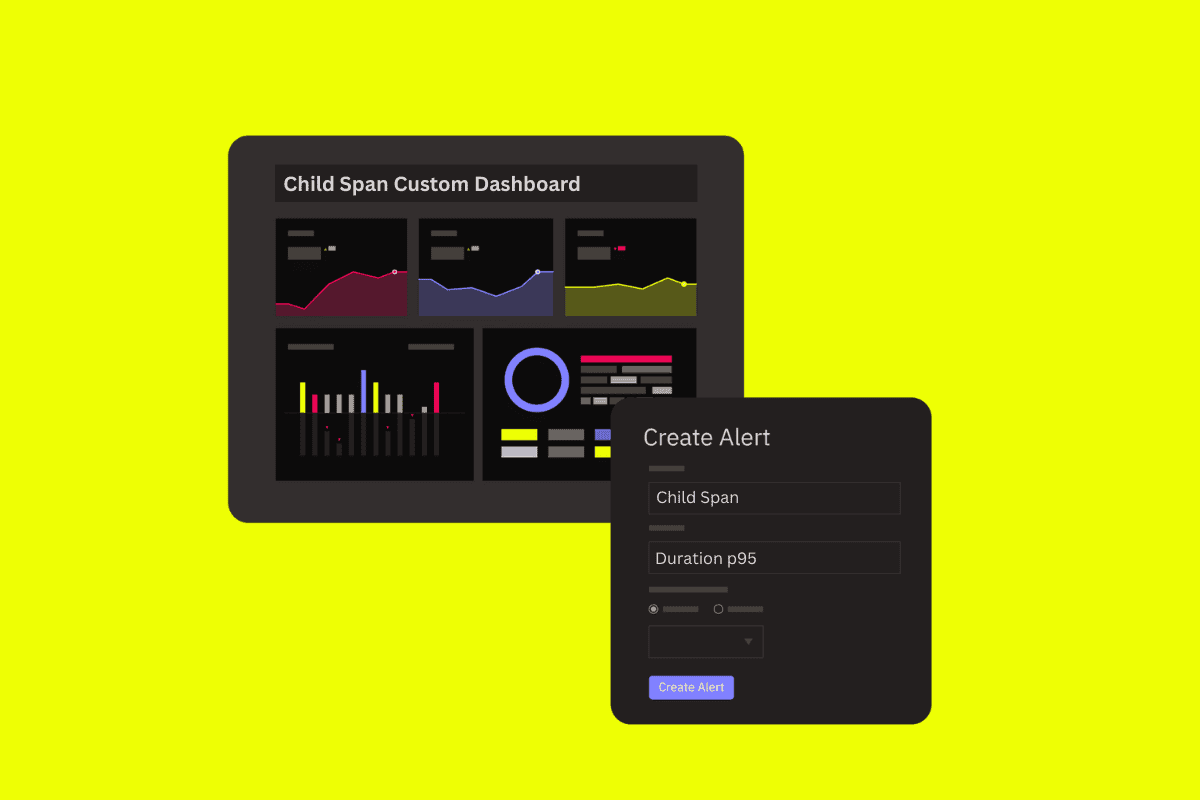
To help our customers even better analyze network request spans, we will be introducing a few more feature upgrades in the near future. The first of these will be to highlight anomalous network spans in the dashboard. This feature will help users identify irregular, potentially erroneous behavior by allowing them to understand if the trace they are viewing is an outlier or typical compared to the observed pattern of behavior for a given endpoint. For example, if a specific instance of a request takes 10 seconds when on average, that type of request usually takes 1 second, this would be indicative of a problem.
As another feature upgrade, users will be able to compare network spans with those spans from other app versions, making it easier to detect regressions or improvements over time.
Additionally, network spans will soon be able to contain specific network request attributes to enhance troubleshooting from the mobile client side. Users will be able to filter or spot network request spans based on attributes such as retries, and DNS lookups. This detailed information empowers users to pinpoint the exact causes of network-related performance issues, facilitating faster and more accurate debugging.
Our continued work in making network spans a more integrated, usable part of Performance Tracing is another step forward in our mission to provide robust, user-friendly performance monitoring tools. Customers can expect their performance investigations to become even more efficient and effective, ultimately improving your overall experience.
Stay tuned for more updates as we continue to refine and improve our platform.
Get started today with 1 million free user sessions.
Get started free