performance monitoring

Embrace's Performance Tracing feature is made even better now that spans can be used to build custom dashboards and create proactive alerts.
Late last year, we made Performance Tracing available in open beta for Embrace customers. Now, we’re excited to roll out some exciting new feature additions that make it all the more useful for mobile engineers.
As a refresher, Performance Tracing is a feature designed to let engineers monitor any user flow they care about within their mobile app.
To do this, you segment a larger user flow into smaller chunks of work that are called “spans.” Instrument a span around any operation you’d like to monitor in your source code by calling an API at the beginning and end of the specified portion of work. When you instrument one or more connected spans that together make up the entire process of a user flow, also known as a “trace.”
Traces constitute the end-to-end journey of one or more connected spans. When traces stretch across many different connected services and end up traversing all the way to the backend, this is called distributed tracing.
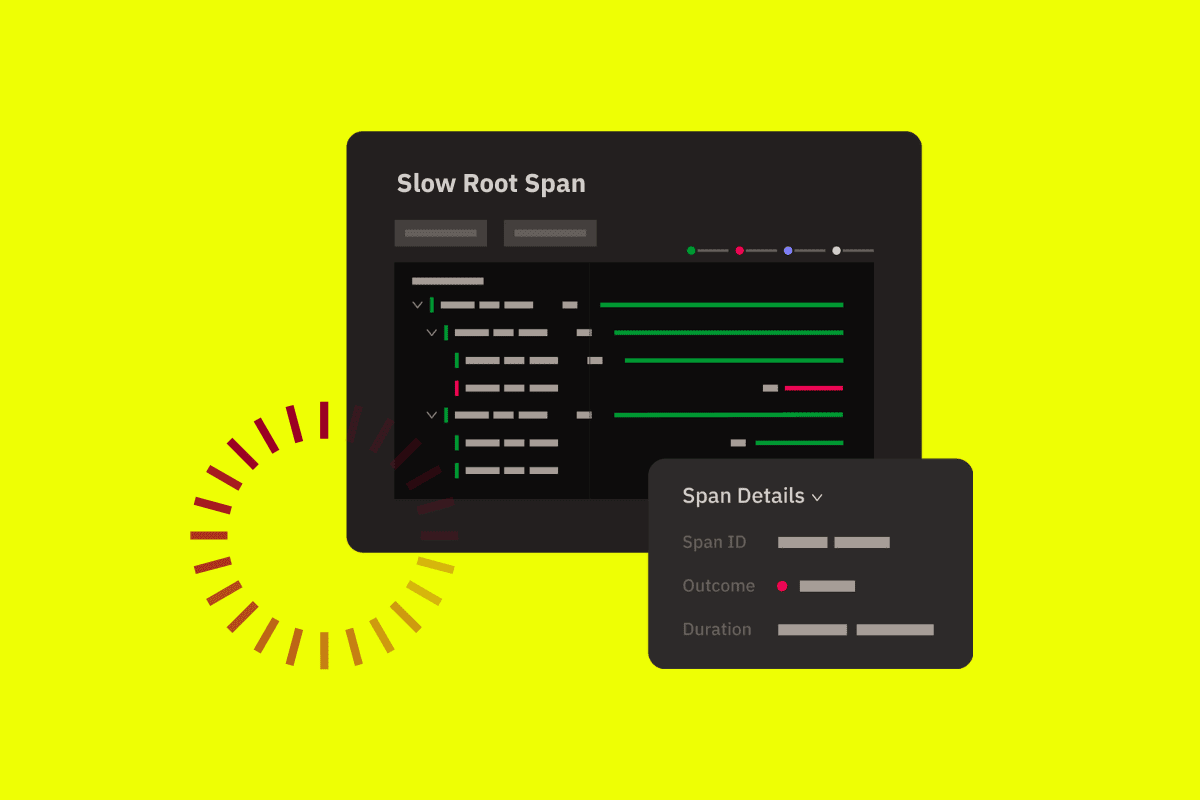
Performance Tracing at Embrace allows engineers to set up spans around frontend operations in their app’s code, and to examine the success, failure, and latency of these within our dashboard. Additionally, our feature supports custom attributes and events for spans, so engineers can provide even more context around an operation they’re measuring. The hierarchical nature of spans also allows for parent-child relationships, so sub-operations can be captured with however much granularity is needed to fully analyze the flow.
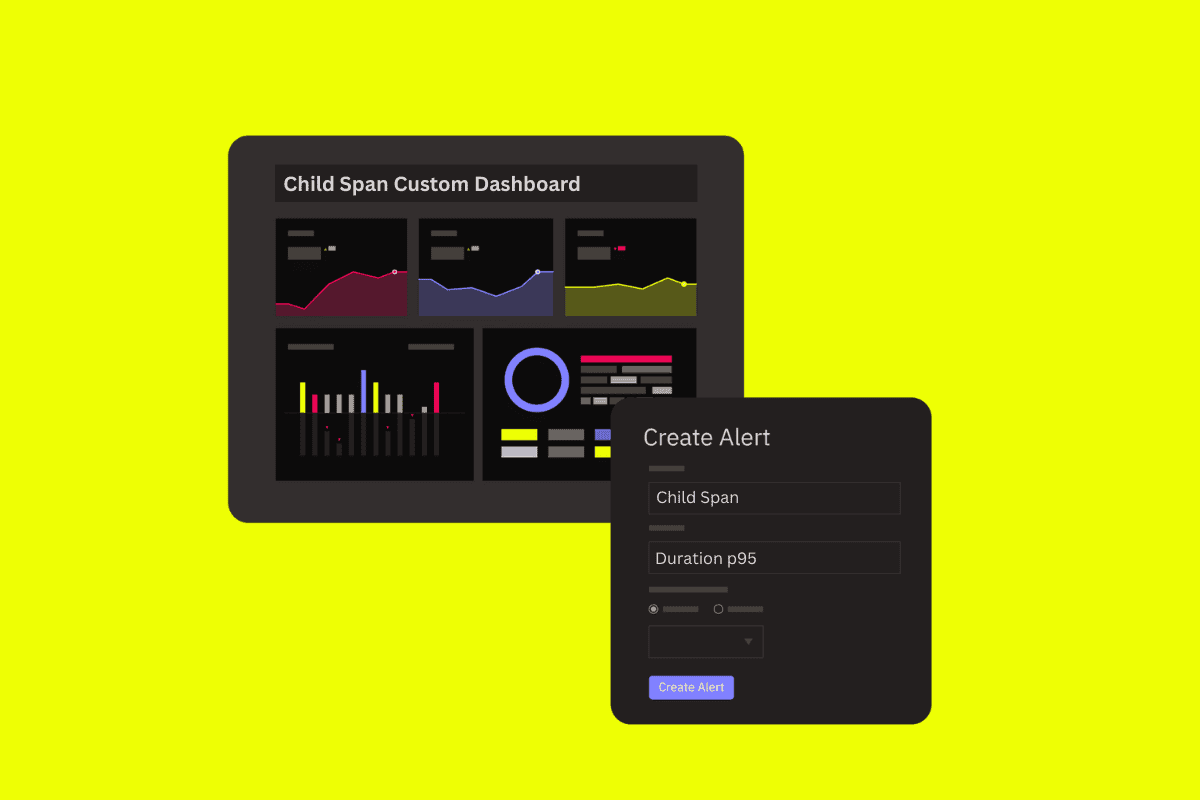
As part of our full release of Performance Tracing, engineers can now include individual spans in their custom widgets and dashboards within the Embrace tool.
When building a custom widget in the Dashboards section of our platform, you can now choose “spans” as a data source and look at various span metrics at a high level. These include the number of failing, successful, or abandoned spans, the span user count, and the span median duration. You can also apply groupings and filters on top of the main span metric that you’re looking at, like app version, OS version, device type, and geography.
This added feature makes it easier to understand how well your spans and traces are performing overall, and also helps to quickly flag if there are any anomalies starting to emerge.


In addition to spans as a new data type for custom widgets and dashboards, they’re also available in Embrace’s proactive alerting system.
You can now set up an alert based on many different types of span metrics. These include span count, span median duration, as well as the percentage of successful, failing, or abandoned spans.
As with all Embrace alerts, you can further refine span-based alerts with default user attributes like device type, OS, app version, geographic location, and more. Sync your alerts with email, Slack, and PagerDuty to make sure your teams are notified about issues within your instrumented flows before they start impacting an outsized number of users.

Our latest updates to Performance Tracing makes this feature even more helpful for customers who rely on the Embrace platform to monitor and troubleshoot custom user flows. But what if you want to look at your spans data outside of Embrace, perhaps within a platform you use to consolidate metrics from other monitoring tools?
Soon you’ll be able to do exactly that with Embrace’s OpenTelemetry-compliant SDKs. As part of our ongoing modifications to reach full OTel compliance, we’re working diligently in the background to ensure that customers can forward individual spans to the observability backend of their choice.
This functionality is already available for customers monitoring network requests as custom spans via our Network Span Forwarding product, which connects the mobile frontend with the backend in a way that’s not available by any other vendors in the observability space.
Watch this space as we continue to build out our span forwarding capabilities and request a demo today to learn more.
Get started today with 1 million free user sessions.
Get started free