WEBINAR Dec 9 | Fireside chat: The future of user-focused observability with Embrace + SpeedCurve.

Sign-up

Why good P99s aren’t good enough on mobile

Learn key challenges in measuring mobile app performance and why you need a different approach than the metric percentile approach used for backend systems.

This article was originally published on The New Stack.

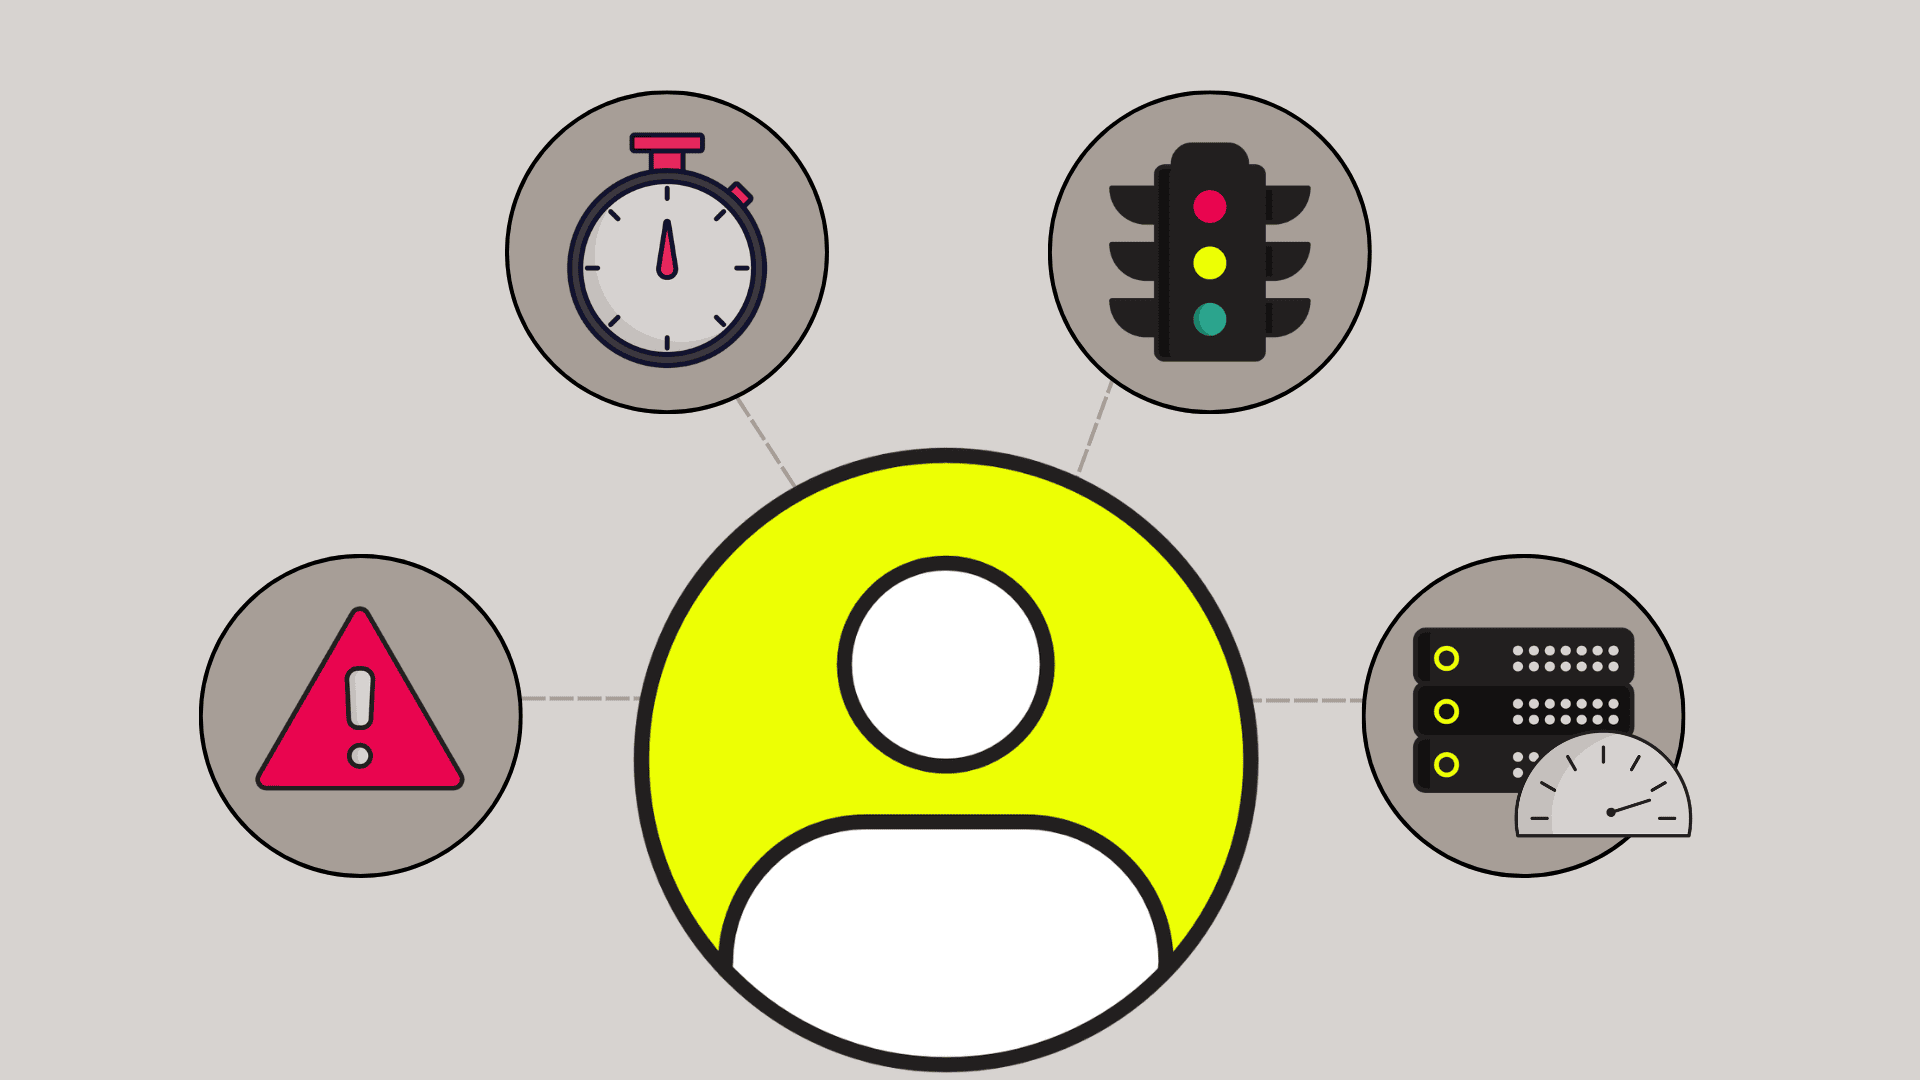
Before Observability 2.0 practices became commonplace, site reliability engineers (SREs) ensured their backend systems were behaving within expectations by monitoring key metrics. Apps would be instrumented so real-time performance metrics were reported and aggregated in production, with outliers being surfaced through dashboards and alerts.

You monitored performance in terms of percentiles, and if, for example, the P99 of execution time in a key service spiked, it might be time to investigate.

Now, while I’m not going to argue the previous Observability 1.0 approach was the end-all-be-all, I think we can all agree it worked. Or at least, it got the job done, for some definition of the job.

But then, why wasn’t this approach adopted by mobile teams? After all, mobile is one of the most complicated ecosystems, and poor app performance and frustrating user experiences are leading contributors to brand erosion.

If measuring app performance with P99s worked for backend systems, shouldn’t it work for mobile apps?

In short, no. I’ll cover why, and what a better approach is, but before I do, it’s important to understand why Observability 1.0 never took off for mobile teams.

Mobile teams are currently on observability 0.5

In mobile, to ensure their apps are stable, devs generally look to what mobile platforms and vendors provide. Typically, these include listings of top crashes, “Application Not Responding” (ANRs), and other easy-to-obtain metrics that sum up the problems faced by users in aggregate. Vendors also offer a more detailed view of individual devices and user sessions so production problems can be debugged without devs needing to reproduce them themselves. Really diligent teams that want more details about how their apps perform typically rely on synthetic performance tests or local tracing to surface regressions or structural issues in the code causing poor performance.

However, active collection of performance data in production that platforms don’t provide out of the box isn’t widely done on mobile.

For instance, while Google gives you coarse-grained performance metrics on things such as app startup, devs don’t have access to the raw data, and the metrics can only be consumed in aggregate on the Android Vitals dashboard. Collecting them with bespoke instrumentation is possible, and while it’s done at many major tech companies, setting up the infrastructure to record, report, process, and visualize this data is a non-trivial amount of work, and usually prohibitively expensive to do.

For this reason, even as vendors like Embrace emerge to provide mobile app performance instrumentation as a service, the practice is not widespread in the mobile world. Mobile teams tend to already be up to the gills with existing production issues like crashes and ANRs for them to triage and fix in addition to feature development. Getting data on performance in production just to find more problems to fix is not something most mobile teams actively do unless devs are intrinsically motivated or if there’s a top-down mandate that requires them to do so.

If we consider Observability 1.0 as having those key three pillars of logs, metrics, and traces, that means mobile teams are leaving one very big pillar on the table. In other words, forget 2.0 – even Observability 1.0 tooling isn’t well adopted for Android and iOS apps.

Measuring percentiles in mobile can be misleading

Mobile teams taking their first steps into the observability world by measuring the duration of network requests, page loads, or bespoke client operations should be wary of the pitfalls of fully trusting percentiles like their backend counterparts.

On mobile, percentiles only tell part of the story; what they miss can potentially render even fast P99 times meaningless. Traditionally, mobile performance data for an app operation in production is only counted if all of the following are true:

  1. Measurements have been properly recorded by the app and received by the server.
  2. Operations have completed.
  3. Users have not churned due to poor performance.

Let’s dive into each of these three challenges in more detail.

Missing telemetry

One of the biggest differences between mobile and backend observability is the fragile pipeline between capturing telemetry on device and the arduous journey it to a database on the backend, ready to be used. Data loss is a constant threat, given the flakiness of mobile operating systems, app life cycles, network connections, and the behavior of users whose experiences we are so desperate to understand.

If this pipeline isn’t fortified to handle all expected edge cases, you could be losing a significant amount of data because all it takes is one break in the link. That’s why you need data about how successfully telemetry is being recorded, persisted, and sent – even under suboptimal hardware, software ,and environment conditions. Yes, it means your instrumentation needs instrumentation.

And what’s worse about breakages in this pipeline is that data loss will likely be skewed toward devices that perform poorly, as those app instances are the ones most likely to fail to record or send telemetry because they are under duress. This would lead to your telemetry having a survivorship bias, painting a rosier picture than it really is.

Incomplete operations

In most monitoring and observability platforms, telemetry is recorded only for operations that complete. In OpenTelemetry, only spans that have completed, successfully or otherwise, will be exported. On the backend, instrumentation should know when a traced operation completes, and then record telemetry for it, whether it succeeded or not.

But on mobile, operations can end abruptly without the underlying instrumentation knowing about the termination. This could be due to unanticipated user abandonment of a key workflow, simply having the app crash or the operation end without the instrumentation getting a chance to mark the operation as having failed.

While robust platforms can more or less account for incomplete operations, you can’t really aggregate them with the completed ones. So by simply looking at percentiles of operation execution time and tracking their changes, you’re missing a key piece of information: What is the percentage of operations that didn’t complete, and how does that affect the way you examine the raw percentiles?

Taking that a step further, how will you answer the question of WHY you are seeing the changes that you’re seeing? While just knowing that failure and abandon rates have increased is half the battle; the other half is being able to explain the reasoning behind the increase.

Churned users report no data

The most insidious reason why looking at percentiles is insufficient for mobile devs is that poor performance leads people to stop using the app. And unlike backend systems, poor client performance is often linked directly to the user, their device and the environment in which they use the app.

While backend systems might distribute the pain of poor performance evenly among their users, only those specific users of apps that are performing poorly are experiencing the pain, and that pain will never go away unless something on their end changes – or if the app improves.

In other words, poor app performance creates a barrier of entry for certain users who can never achieve an acceptable level of performance. You’ll always have an invisible cliff edge where people who want to use your app will fall over. Their  annoyance caused by poor performance is so great, they just stop using your app. Whether this is because the device they use is of poor quality, the network connection is too slow, or they are simply too impatient to put up with waiting, bad performance leads to churn, and churned users report no data.

Performance regressions, in this case, are a silent killer. The P99, however good it is, will never fully include the impact from users that churn, because while they’ll report data for a little while, those measurements will be drowned out by instances of happy users who report performance data in greater volume. For those users, the app will be, by definition, “fast enough” for them, seeing as they are continuing to use the app.

To make a concrete example, let’s say you have an app with 200 daily active users (DAU). Each day, 199 happy users and one unhappy user launch the app, with the unhappy user then getting frustrated and churning. When looking at percentiles, a single happy user that uses the app for 30 days is equivalent to 30 unhappy users who each use it for a day.

If you look at P99 for the month, it will not include the unhappy users. So even though you continue to have a DAU of 200, the fact that you’ve lost 30 users will not be surfaced if all you looked at was P99, as 199 of the DAUs stayed the same, but the other one changed every day.

How can mobile teams do better than monitoring P99?

Mobile teams that want to do better than look at the same old mobile metrics to understand app performance more holistically should go beyond Observability 1.0 and the monitoring of basic metric percentiles like P50 and P99. Instead, you should adopt the practices of Observability 2.0 and ensure that enough context is sent along with the telemetry so data can be properly sliced and diced to find out the real reasons behind performance regressions.

Before that, though, you have to ensure that mobile app telemetry is properly recorded so app failures and user abandonment are adequately accounted for. Understanding your actual churn rate is also vital in highlighting where you might be missing data. After all, you can’t collect data for people who have stopped using your app out of frustration.

Once you’re collecting a more nuanced set of data that represents mobile app performance from the user’s perspective, you can find out under what specific conditions performance bottlenecks affect your app.

The easy button for mobile observability

Embarking on your mobile observability journey can be intimidating if you had to start from scratch. Even if you just wanted to use the mobile OpenTelemetry SDKs for Android and iOS, you would still need to stand up Collectors to ingest your data and create dashboards so you can visualize your data. And that’s assuming you’ve already dealt with the client-side challenges in your app outlined earlier.

The good news is that you don’t have to start from scratch, as platforms like Embrace, which is built on OpenTelemetry, can give you a head start by providing everything you need to understand the end-user experiences in your mobile app as well as measure app performance.

In other words, you’re not beholden to using only percentiles like P99s to understand how your mobile app is performing in production. If you’re already using OpenTelemetry, you can start incorporating mobile telemetry into your service-level objectives (SLOs) in a meaningful way by linking them to the telemetry you already collect in the backend. To learn more about how to overcome some of the key challenges in mobile observability, check out our in-depth guide.

Embrace Deliver incredible mobile experiences with Embrace.

Get started today with 1 million free user sessions.

Get started free
Related Content

User Flows in practice

Learn how, and why, to create User Flows that target the mission-critical parts of your mobile and web applications.

Embrace Open Source Roundup

Take a journey through our engineering team's recent contributions to open source projects in web, mobile, and observability.