WEBINAR Dec 9 | Fireside chat: The future of user-focused observability with Embrace + SpeedCurve.

Sign-up

How we engineered capturing Android ANRs in OTel

Learn how Embrace adapted its approach to collecting “application not responding” (ANR) data for OpenTelemetry (OTel).

This article was originally published on The New Stack.

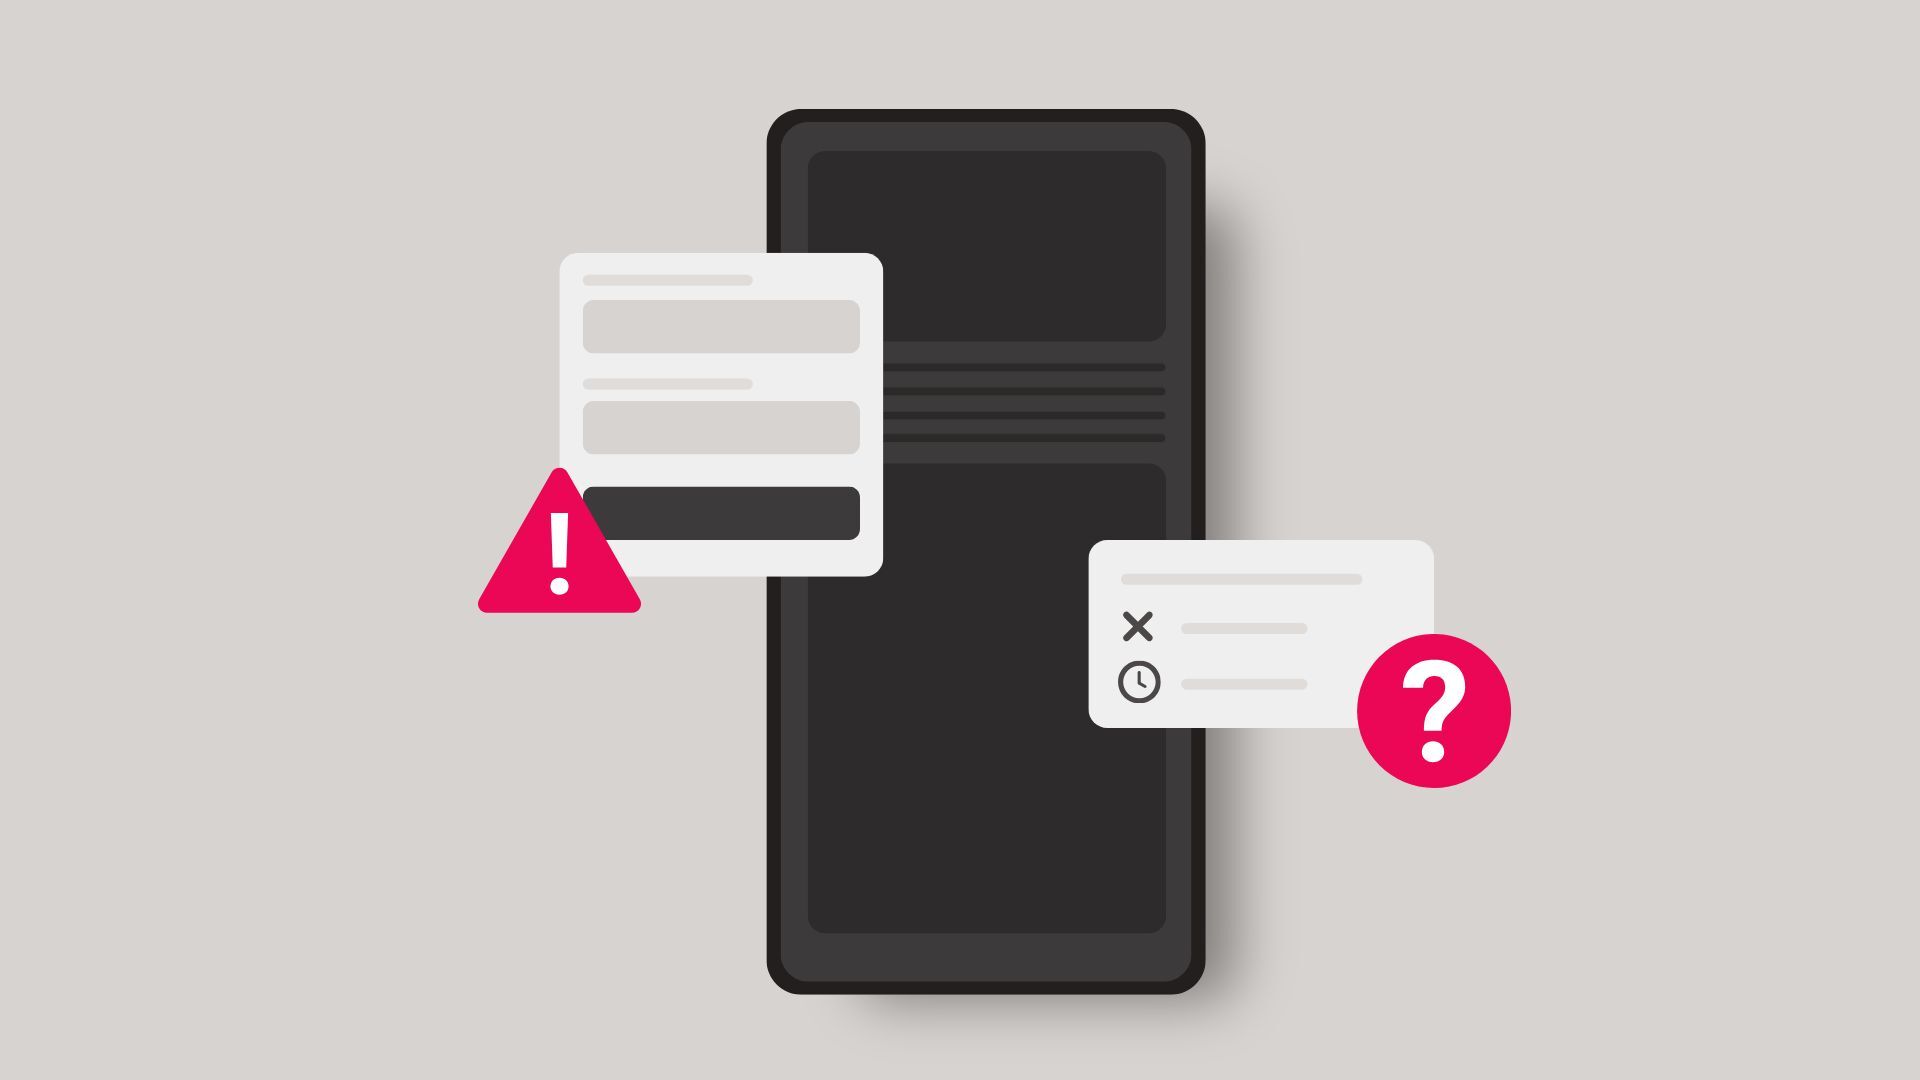
On Android, one of the toughest user experience issues to solve are ANRs (application not responding) errors. If the main thread is blocked on Android for more than five seconds, the user may see a dialog that encourages them to kill the app. Since mobile observatory platform Embrace has fully adopted OpenTelemetry as our standard for modeling mobile telemetry, we needed to find a way to model ANR data collection into OTel signals.

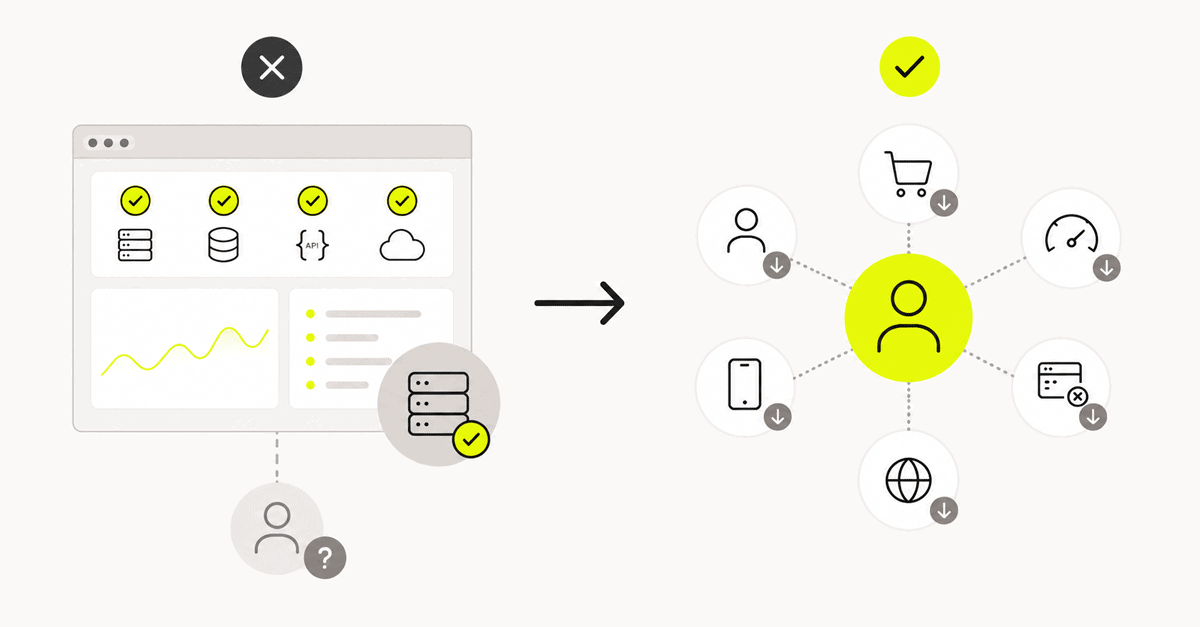
Here’s how we updated our ANR approach to align with OpenTelemetry.

What Is an ANR?

The simple definition of an ANR is when Android’s user interface (UI) thread is blocked for more than five seconds while a user is attempting to interact with the application.

Android follows the widespread pattern of using a single thread to display the UI. Therefore, blocking this thread with disk reads, network calls, or slow calls can lead to a disastrous user experience, as the UI will be unable to update in response to a user tapping or scrolling. Android devices can also be very underpowered in CPU/disk resources compared to beefy servers, so a seemingly innocent operation, like reading a file, could easily take seconds in the worst case.

If you’re familiar with the very annoying experience of repeatedly tapping your phone screen but nothing happens, then you’ve probably experienced an ANR!

Android Vitals defines ANR rate as the percentage of devices that experience one or more ANRs a day. This is important because if your app is on the Google Play Store and has an ANR rate exceeding 0.47%, its organic traffic will be penalized. Not to mention this will likely result in negative customer reviews and increased churn.

If you’re interested in learning more about the conditions under which an ANR is triggered, read our blog post on how an ANR works.

How can you capture ANRs on Android?

There are several ways to get insight into production ANRs on Android.

Watchdog approach

Most mobile developers are familiar with Google Play Console’s approach, which works by capturing a stack trace of the UI thread and other useful metadata five seconds after it has been blocked. This is the watchdog thread approach, which is used by Google Play and several other libraries. A background thread posts a message to the UI thread, and if the message isn’t processed within five seconds, it indicates the UI thread is unresponsive.

However, there are downsides to this approach. Android shows an ANR dialog only when the user is actively touching or scrolling a phone. So if a UI thread blockage happens and nobody is watching, Android effectively ignores it and doesn’t show the ANR dialog. App developers don’t have access to the same user input queue that the operating system does, which makes the watchdog approach prone to a lot of false positives compared to Google Play’s ANR metrics.

ApplicationExitInfo API approach

Another approach is ApplicationExitInfo (AEI), which is an API available on Android 11+ that contains the ANR stack trace that is reported to Google Play Console. However, the API has some limitations in that only one ANR can be recorded per process, and it can be sent only after the process has exited. This makes it impossible to get accurate metrics on how many ANRs happened across your entire mobile fleet, although it does have the advantage of not having false positives like the watchdog approach.

SIGQUIT handler approach

Finally, another approach is to set a SIGQUIT handler in C code. The Android OS triggers an ANR by sending a SIGQUIT signal, but doesn’t actually terminate the application. So it’s possible to set a handler for this and record the timestamp when an ANR happened. This is advantageous, as it allows an accurate metric on ANRs to be calculated for the entire mobile fleet.

The downside is that running code in a signal handler imposes severe limitations that make it effectively impossible to record useful diagnostic information at the time of the SIGQUIT signal. Additionally, the Android implementation is not POSIX compliant, and there are several footguns. These include crashes that terminate the process or timing issues that prevent the SIGQUIT signal propagating to other handles, which can affect ANR metrics on Google Play Console.

Our pre-OTel approach to ANRs

Embrace’s software development kit (SDK) captures all these pieces of information to detect ANRs. We capture AEI and SIGQUIT and sample the main thread for stack traces at regular intervals. Combining all this information holistically provides more context about what caused a thread blockage and how it evolved over time, versus one stack trace captured at the five second mark.

Before OTel, we represented all this information in a proprietary JSON schema. Every change we made to display new data in our observability platform required the following steps:

  1. Decide on a schema between SDK, backend and frontend.
  2. Implement SDK changes.
  3. Implement backend changes.
  4. Implement frontend changes.
  5. Verify implementations end-to-end.
  6. Deploy changes and implement new monitoring.
  7. Iron out any bugs from implementing one-off code solutions.

This process could take a long time, as it spanned multiple teams with competing priorities, and we went through lots of iteration and experimentation when deciding what data made sense to capture. Thankfully, adopting OTel has made this process easier for any future changes.

Moving ANR capture to OpenTelemetry

When we adopted OpenTelemetry as our core data model for the mobile telemetry we collect, we quickly realized that modeling ANR collection in OTel would be our most complex SDK feature. However, it was clear that the proprietary schema approach had frustrating pain points that we needed to move away from. We decided to model our ANR telemetry with the following constructs:

  1. SIGQUIT as a Span Event on the embrace session span. This was straightforward, as we only really needed the timestamp of when a SIGQUIT happened.
  2. ApplicationExitInfo as an OTel Log. The log attributes contained the ANR stack trace and various other ANR metadata. This posed an interesting challenge as ApplicationExitInfo is only available after a process terminates. We got around this by storing the span ID on process termination and then setting it as an attribute on the log.
  3. UI thread stack trace samples. We modeled this as a span where the start/end time measured when the thread was blocked or unblocked. Each sample was modeled as a span event that contained attributes such as the stack trace and other metadata.

Since this is one of the most complex areas of our product, we decided to retain a lot of the existing capture mechanisms and map them into OTel primitives.

How does this simplify our data collection approach?

This has been a big improvement on our previous approach, which nearly always required database schema changes and custom processing. Now, when we want to make changes in how our SDK collects ANR data, the process looks like:

  1. Model any new data types as OTel.
  2. Follow agreed-upon conventions between the SDK and backend on how the telemetry will be structured.
  3. Implement the SDK changes.
  4. Display the new data in the dashboard.

This new approach has significantly reduced our iteration time. Although we still write custom processing to better highlight certain features, it’s much less than before, and it doesn’t block us from shipping features to production.

Are there any downsides to using OTel for ANR data?

When an ANR happens and a process exits, the Android operating system writes a file to disk (ApplicationExitInfo) that contains a stack trace and useful metadata on what happened in the ANR. This is a complication because it means the ANR happened in one process, but we can only report the details of that fact in another process. It also somewhat works against the regular OTel workflow as it’s necessary to stitch together disparate pieces of data.

Our solution is to record a session ID in the process that has an ANR and write that value to disk along with ApplicationExitInfo. The second request that contains the ANR details also contains the session ID as an attribute. That way, our backend can then stitch the two together.

An additional downside is that most applications distributed in app stores are run through code optimization tools like R8 or DexGuard. These tools shrink, obfuscate, and optimize code to reduce build size, improve performance, and increase security by rendering the transformed code unreadable. This means it’s necessary to use a mapping file that is created at build time to get readable stack traces from production. At the time of writing, OTel does not have built-in support for this concept.

Next steps with modeling ANRs in OTel

Because capturing this ANR data is one of the most complex features in our SDK, we decided to map existing capture mechanisms into OTel. One key next step for us is to capture some of this data directly via OTel constructs rather than mapping data.

One interesting challenge is determining how to sample data. Mobile devices have far fewer resources than backend servers, and capturing ANR telemetry can generate an enormous amount of data. Previously with our proprietary approach, we had limited data capture to the five longest ANRs that happen in any one user session. As we progress with our OTel integration, we’ll have to find a way to limit data capture within the OTel paradigm without decreasing the quality of data capture.

Adopting OTel for our ANR capture implementation has definitely reduced pain points for our internal development, and we look forward to future improvements. If you’d like to learn more about mobile observability with OpenTelemetry, you can check out our open source SDKs, head to our website or join our Slack community.

Embrace Deliver incredible mobile experiences with Embrace.

Get started today with 1 million free user sessions.

Get started free
Related Content
OpenTelemetry panelist headshots with leaf backgrounds

Pumpkin spice and OpenTelemetry for mobile panel recap

In this OpenTelemetry expert panel, we discuss the challenges of collecting telemetry in mobile apps, why mobile developers struggle with observability, and what the current support for OpenTelemetry is on Android and Swift.