Mobile applications present unique observability challenges that general-purpose platforms weren’t designed to handle. While tools like Grafana offer powerful capabilities for backend systems, they aren’t quite as useful when it comes to debugging mobile-specific issues. This post examines a real-world troubleshooting scenario to illustrate the fundamental differences between traditional observability approaches and user-centric solutions.
Why user-focused observability helps mobile teams resolve issues faster

The challenge: failed checkout transactions

Your support team is receiving multiple reports: “I can’t complete my purchase – the app does nothing when I tap ‘Buy Now’.” As the observability engineer, you need to understand what’s causing these checkout failures.
The root cause? A 15-minute token is expiring during a 30-second checkout flow. The app doesn’t notice, sends a request with an expired token, and gets rejected, causing the flow to break without explanation. Now let’s see how you would find this out with a traditional observability versus a user-centric solution.
Troubleshooting with Grafana + OpenTelemetry SDK data
As an observability engineer, you begin your investigation using familiar tools and workflows. Your open source observability setup includes a mobile app and backend services instrumented with OpenTelemetry SDKs, with logs, metrics, and traces exported to Grafana for monitoring and analysis.
Step 1: Check aggregate metrics
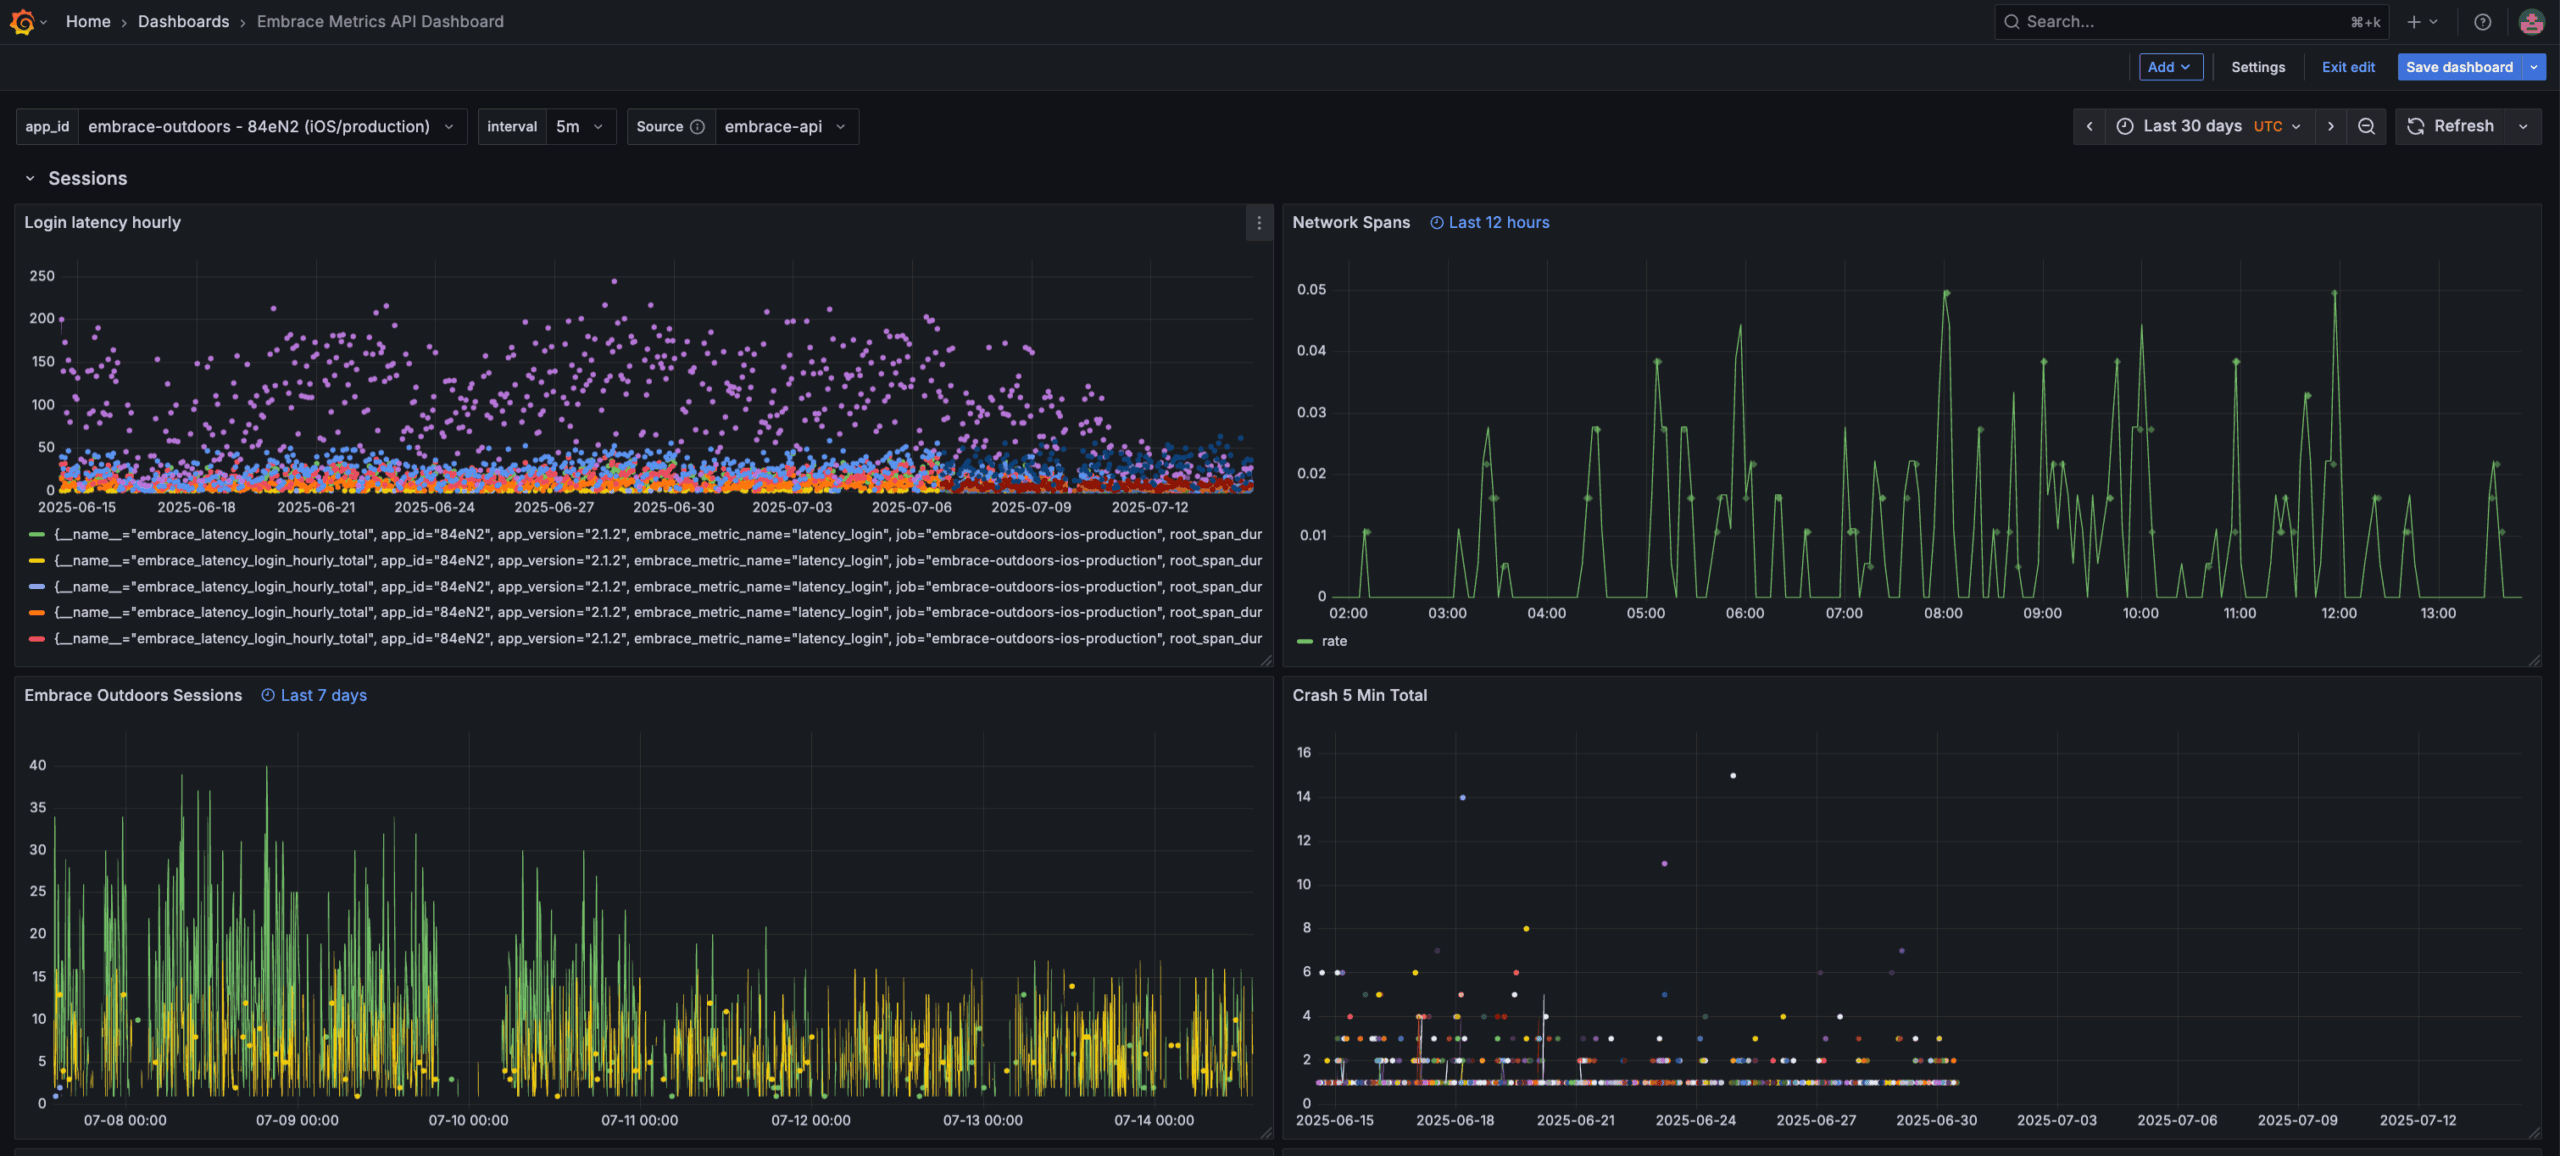
You begin by checking your Grafana dashboards for checkout conversion metrics and error rates, but even identifying the right dashboards can be a challenge. You search for anomalies in metrics like payment_flow_duration_seconds
, network_error_rate
, crash_rate
, and anr_rate
, hoping to find clues. But these signals are often indirect, at best.
For instance, a spike in payment_flow_duration
might suggest authentication timeouts, but it could just as easily be caused by network latency or backend slowness. A rise in the network_error_rate metric
might include the 401 errors triggered from the expired tokens, but there’s no clear way to separate those from general connectivity or login issues. Even if crash or ANR rates increase due to token expiration, these symptoms are too broad to pinpoint a specific root cause.
Ultimately, you’re left trying to interpret high-level performance signals that are several steps removed from the actual issue. And in many cases with an issue like token expiration, there may be no noticeable spike in the metrics at all.
Step 2: Analyze distributed traces
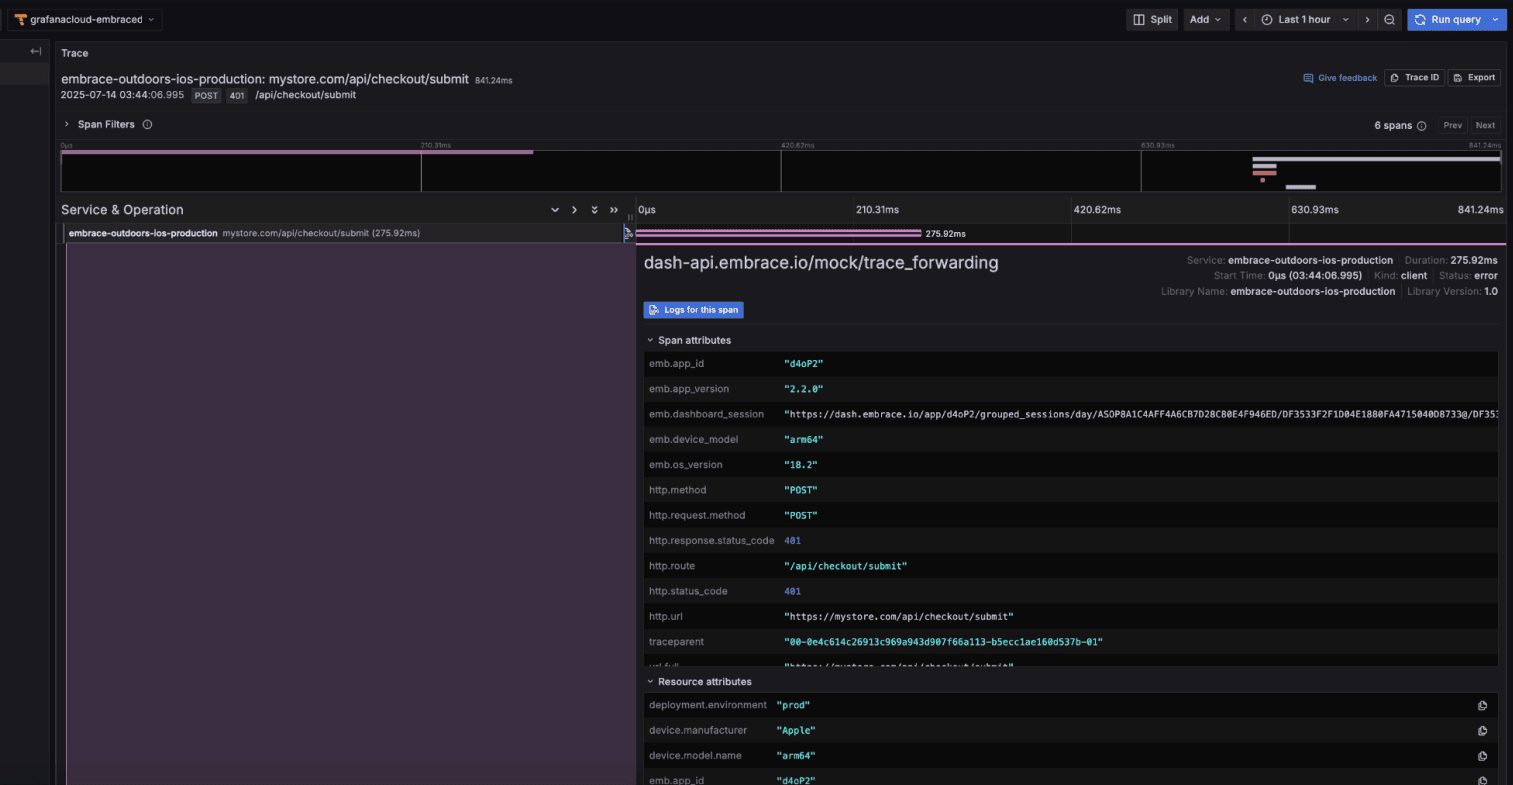
Next, you turn to your tracing tool, Tempo or Jaeger, and search for traces related to the checkout flow, hoping to uncover insights from the Purchase trace. You spot several failed payment attempts marked with generic error indicators. Occasionally, a 401 Unauthorized
response appears in the span attributes, but it’s buried in metadata and not immediately clear in the broader context. More importantly, a single trace doesn’t show that the token started out valid and gradually expired over time. Without seeing the full timeline, it’s easy to misinterpret the 401 as a straightforward login error, rather than the result of a slowly expiring token in a purchase session. While the trace tells you that authentication failed, it doesn’t explain why you’re left without the context that connects session age, token expiration, and the failed checkout.
Step 3: Dive into application logs
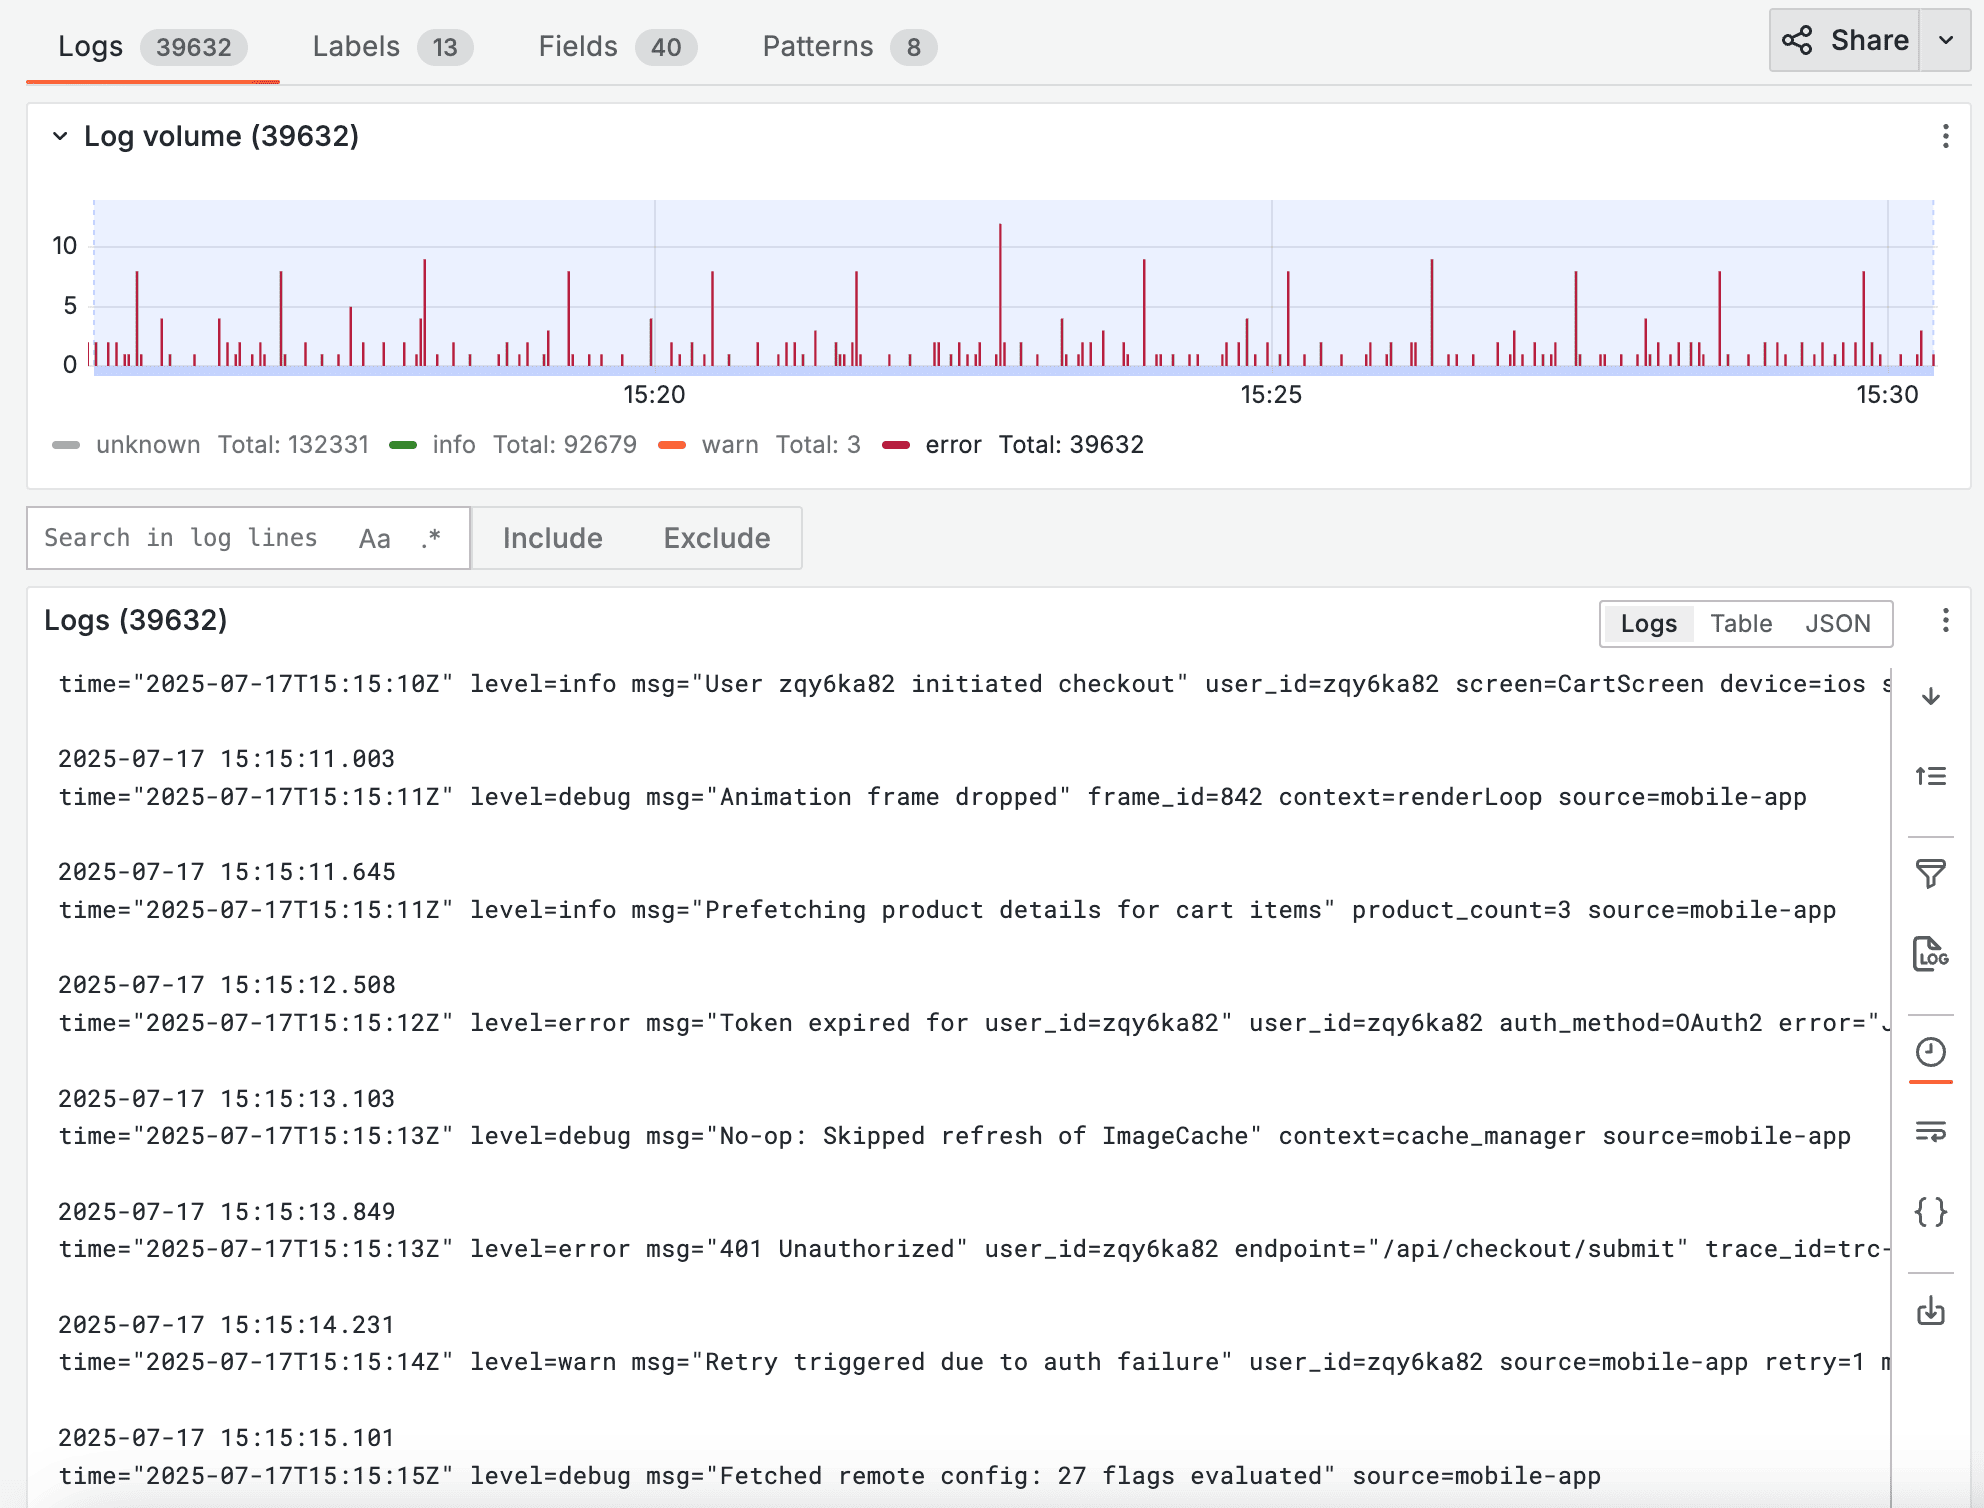
With the 401s from the checkout traces as your lead — assuming you were able to spot them buried in span attributes and recognize their significance — you pivot to your logging dashboard. You begin searching for authentication-related log entries that occurred around the same time as the failed checkout spans, using queries like:
{service="payment-api"} |= "401" |= "unauthorized"
You then add filters to try and isolate all the Error Logs:
This is where things get time-consuming. The log volume is high, and the mobile logs often lack consistent user identifiers, so you can’t easily correlate a specific user’s checkout failure with a specific expired token event. You manually compare timestamps between logs and traces to piece together the sequence of events. Eventually, you notice that some 401 checkout errors align closely with prior “token expired” log entries, suggesting that the token expired during checkout.
This entire investigative path relies on a series of well-informed discoveries: first, identifying the 401 in trace metadata, then understanding it points to an authentication failure rather than a generic permission issue, and finally knowing to correlate it with token expiration logs.
Why this is so hard
The problem isn’t just technical… it’s systemic. Traces, logs, and metrics each give you fragments of the story, but none of them offer a complete, user-centric view. There’s no obvious way to trace a session’s health from login to checkout, or to see how the session aged and when the token expired. You can’t see that the token expired as the user tapped “Buy Now” unless you manually stitch everything together. You’re left guessing, inferring, and hoping you’ve interpreted the signals correctly.
Time to resolution: Often hours, sometimes days depending on how quickly you can correlate everything manually.
Troubleshooting with Embrace
As a mobile observability engineer, you take a fundamentally different approach focused on user session analysis:
Step 1: Locate the affected user session
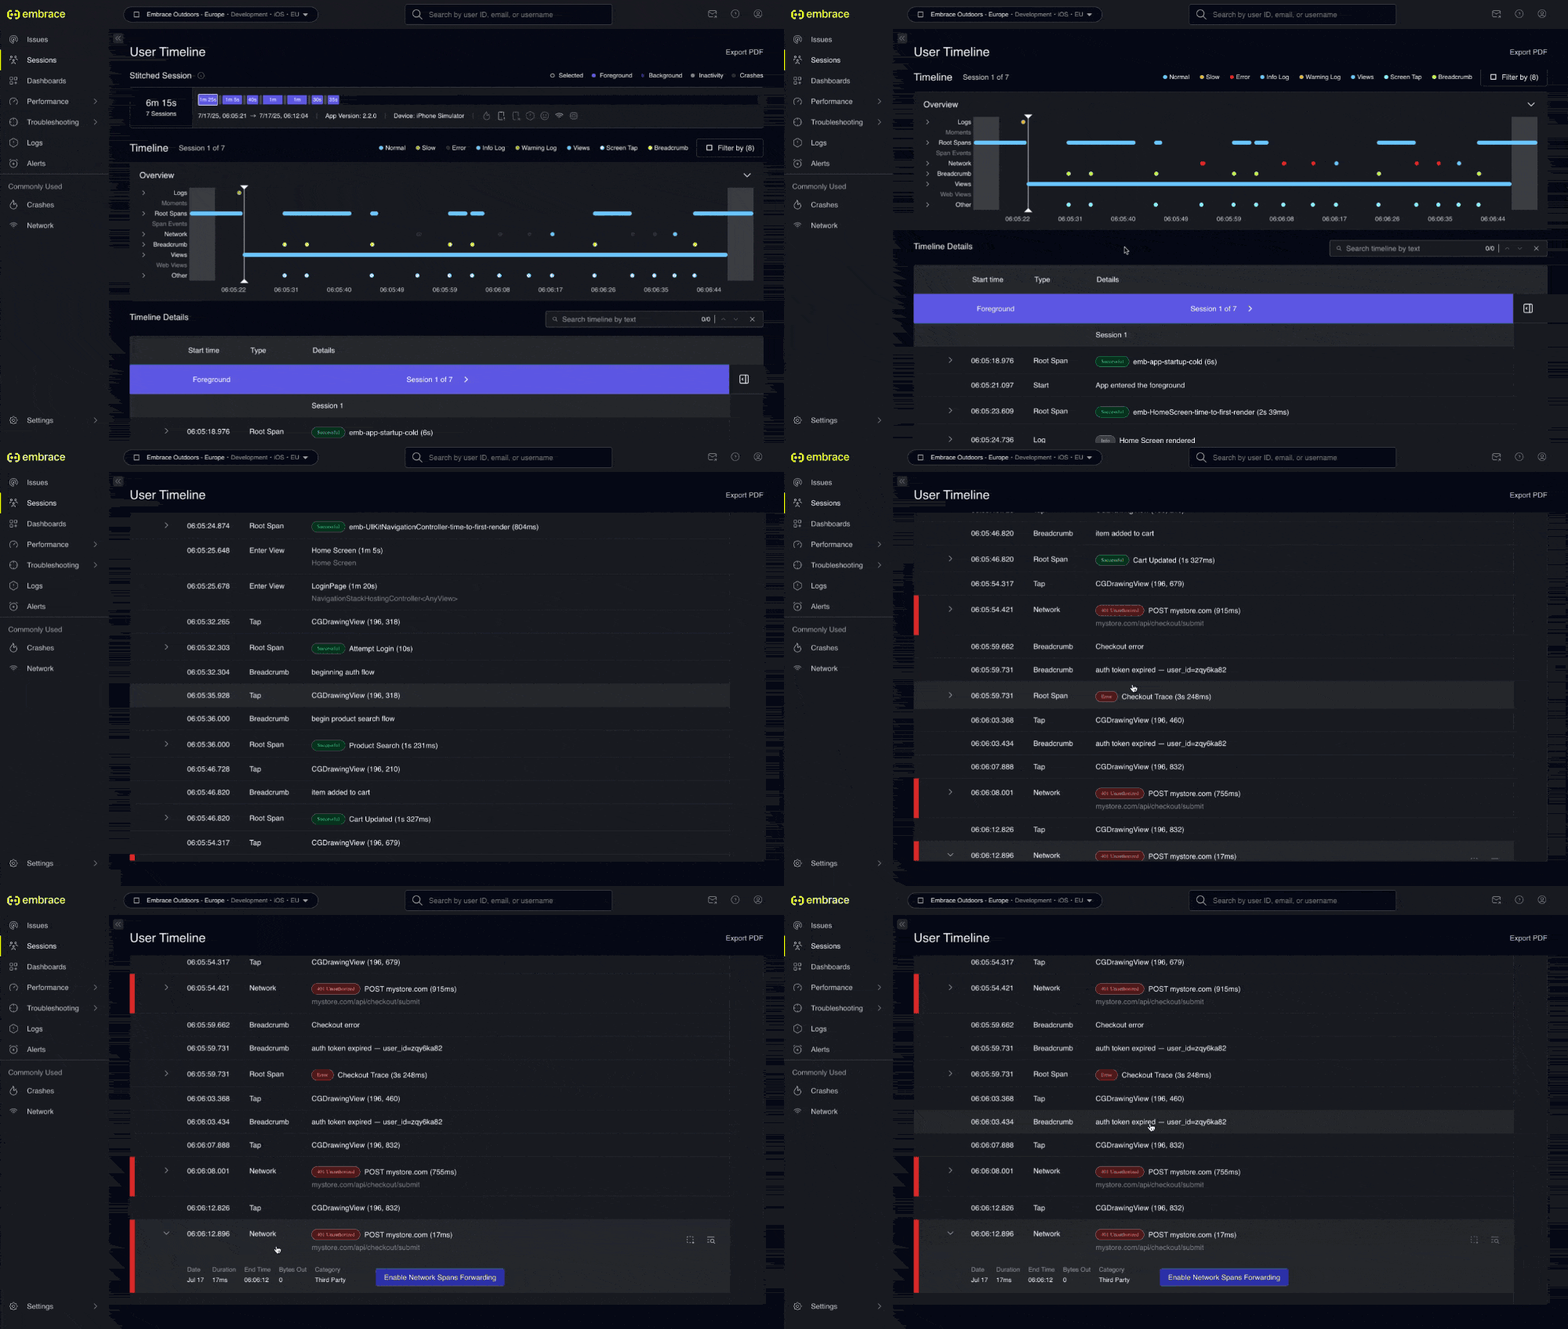
You start by searching for one of the users who reported checkout failures and open their complete session timeline. Immediately, you can see the user’s entire journey: app launch, browsing products, adding items to cart, and finally attempting checkout, then the error.
Alternatively, with Embrace you can also start at a high level, viewing aggregate performance metrics for the checkout flow, and immediately drill down into a specific user session that exemplifies the issue. For instance, if you notice increased checkout latency across your user base in a performance dashboard, you can jump straight into an affected user session to investigate further.
Step 2: Examine the User Timeline for the user affected by the error
Within the session view, you navigate to the checkout attempt and observe the sequence of events in real-time. You can see the user tap “Buy Now,” which triggers the payment API call initialization. At the exact same moment, you notice the authentication token expiration event appearing in the integrated logs on the timeline the token expires literally as the payment request is being constructed. The failing network call and the token expiration log entry are displayed together in chronological order, making the causal relationship immediately apparent.
Step 3: Analyze the failure chain with full context
The integrated timeline shows you the complete failure sequence: The app constructs the payment request with what it believes is a valid token, but by the time the request reaches the payment service, the token has expired. The payment service rightfully rejects the request with a 401 error, causing the checkout to fail. You can also see device context like network conditions and app state, confirming this isn’t related to connectivity issues.
Root cause identified: The mobile app’s token lifecycle management has a race condition in how the app handles token expiration. The token becomes invalid just after the user starts checkout, but before the payment request reaches the server. The app doesn’t catch this in time, so it sends an expired token and the request fails.
Time to resolution: Minutes, with complete confidence in the diagnosis and clear direction for the fix (implementing token validation before payment API calls or extending token lifetime for checkout flows).
The technical difference: context vs. correlation
The fundamental distinction isn’t about data collection; both approaches can gather the same telemetry. The difference lies in how that data is presented and contextualized.
General platforms: metrics, logs, and traces in isolation
General platforms organize logs into authentication events and error messages, while traces capture API call performance and dependencies. Metrics provide aggregate performance indicators, but engineers must manually reconstruct user sessions by connecting these separate data sources across different views.
User-focused observability: a user session-based view
Mobile-specific platforms present a timeline view of the complete user session from launch to completion, with contextual integration that unifies all data types by user session. The platform automatically handles correlation between related events while integrating mobile-specific context like device state, network conditions, and app lifecycle.
Making the right technical choice
This comparison is about selecting the right tool for the specific technical challenge. General observability platforms like Grafana provide excellent infrastructure monitoring, but mobile and web applications benefit from tools designed specifically to measure performance and reliability from the user’s perspective.
The authentication token example demonstrates a broader principle: The toughest mobile and web issues can rarely be identified from a single technical indicator such as a metric, log, or a trace. They’re user experience problems that require understanding the complete context of how applications behave in real-world environments.
For development teams, the ability to see complete user sessions in a unified timeline doesn’t just improve developer experience during issue investigations, it fundamentally changes how quickly and accurately they can identify and resolve issues that directly impact user experience.
If you’d like to learn more about user-focused observability with Embrace, you can start a free trial of our platform or request a custom demo for your team.
Get started today with 1 million free user sessions.
Get started free