In this article, we’ll clarify what sets monitoring, observability, and telemetry apart, and why a clear grasp of these terms is crucial for building resilient systems.
In this article, we’ll clarify what sets monitoring, observability, and telemetry apart, and why a clear grasp of these terms is crucial for building resilient systems.
Understanding the distinctions between observability vs monitoring vs telemetry is essential for anyone managing modern applications, especially in complex, distributed environments. These concepts are often used interchangeably, but each plays a unique role in ensuring system reliability, performance, and rapid troubleshooting. In this article, we’ll clarify what sets monitoring, observability, and telemetry apart, and why a clear grasp of these terms is crucial for building resilient systems.
What is Monitoring?
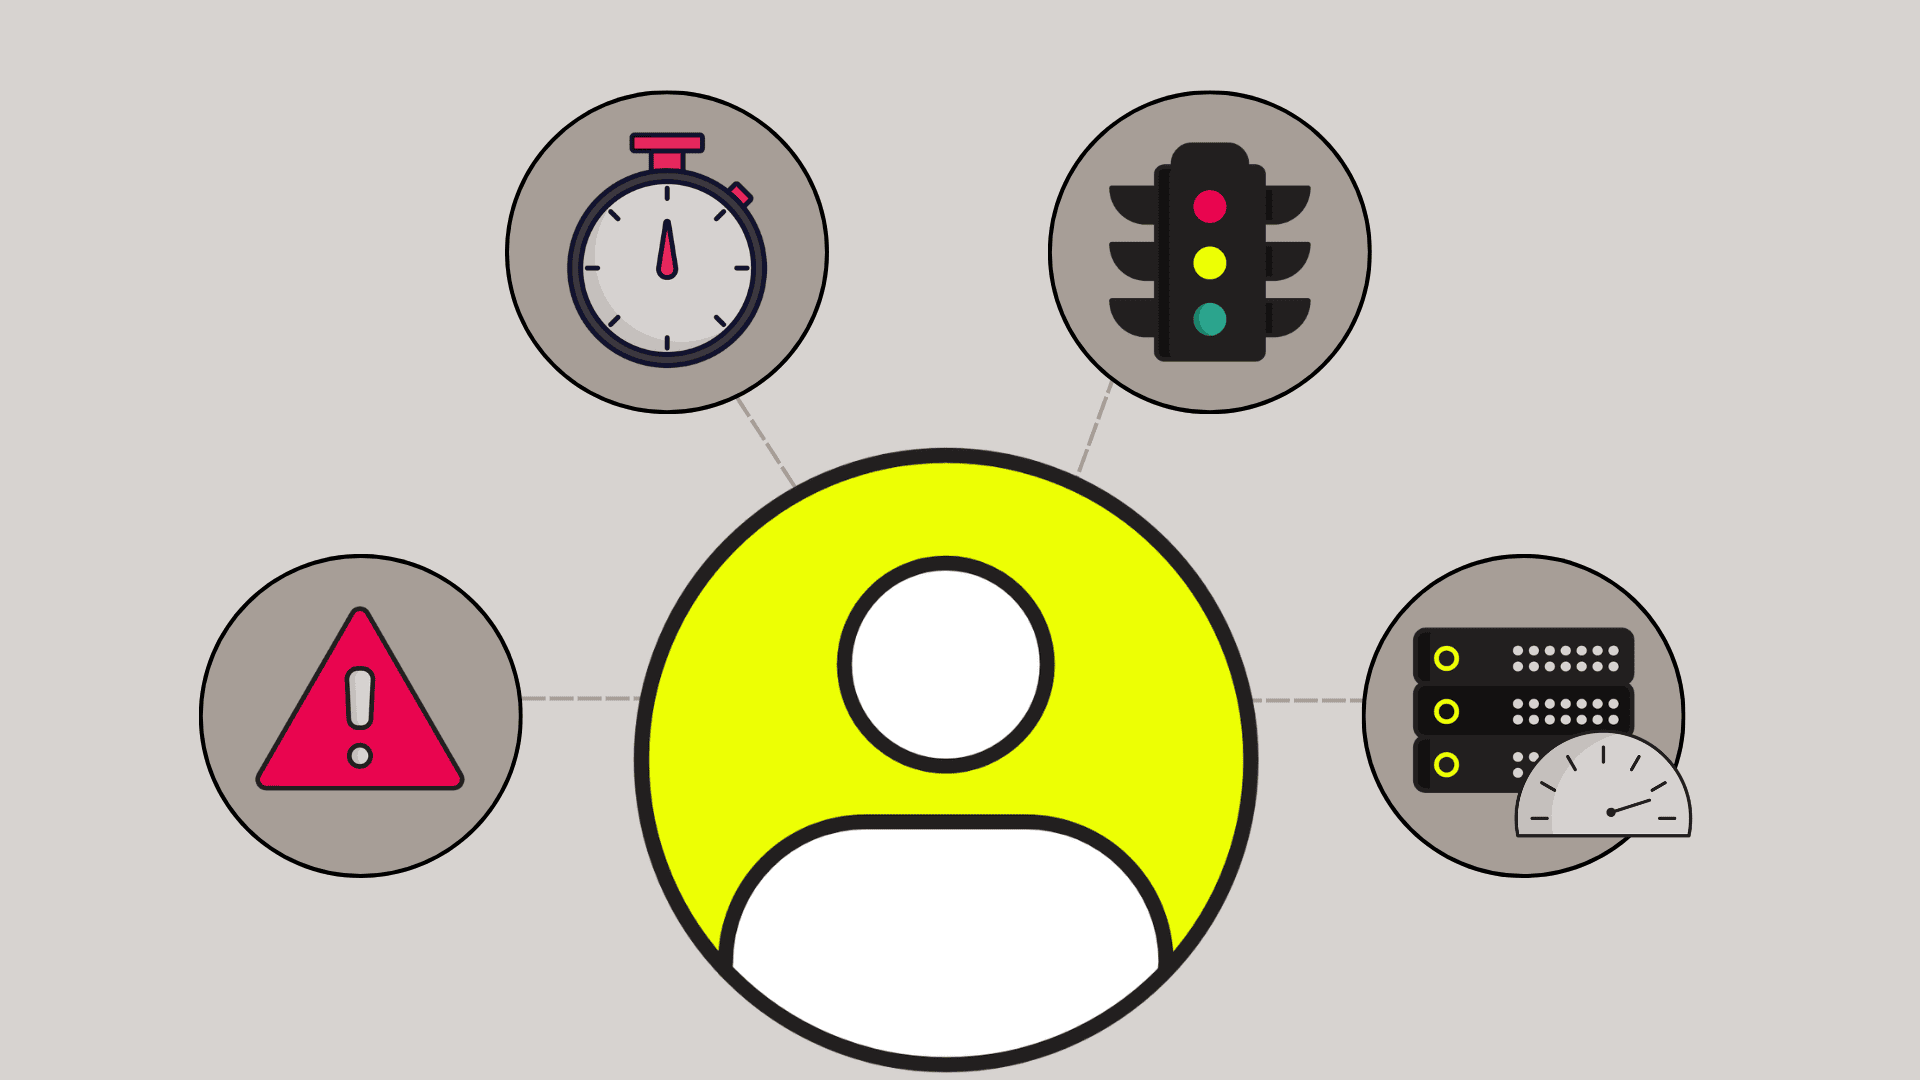
Monitoring is the practice of collecting and analyzing predefined data to track the operational health of a system. At its core, monitoring answers the question: “Is the system working as we expect it to?” It acts as a watchful guardian, observing key indicators and comparing them against established baselines and thresholds.
This process is foundational to IT operations, providing the first line of defense against performance degradation and outages. When a known condition is breached—for example, CPU usage spikes or response times lag—monitoring systems trigger alerts, notifying teams to investigate. It is a fundamentally reactive approach focused on “known unknowns”—problems you can anticipate and define metrics for in advance. While traditional application performance monitoring (APM) tools have long provided these capabilities, their effectiveness can be limited in highly dynamic environments where not all failure modes are predictable.
Key Functions of Monitoring
- Alerting: This is the most visible function. Alerting systems automatically notify SRE teams or IT staff when system metrics cross predefined thresholds. For instance, an alert might be configured to fire if server resource utilization exceeds 90% for five consecutive minutes or if an application’s error rate surpasses a critical level.
- Dashboarding: Monitoring tools provide visual dashboards that display key performance data in real-time. These centralized views allow teams to quickly assess the overall health of their services, from high-level Infrastructure Monitoring of servers and networks down to specific Application monitoring metrics.
- Trend Analysis: By collecting historical performance data, monitoring enables teams to analyze trends over time. This helps in capacity planning, identifying recurring performance bottlenecks, and predicting potential future issues based on past patterns. This includes specialized areas like Network Monitoring, which tracks network latency and packet loss to ensure connectivity health.
- Alerting: Notifies teams when metrics cross predefined thresholds (e.g., CPU usage exceeds 90%). Explore mobile alerting solutions to ensure you never miss a critical event.
- Dashboards: Visual representations of system health, often in real time.
- Trend Analysis: Historical data helps identify patterns and predict future issues.
Tool Types for Mobile Monitoring
- Application Performance Monitoring (APM) Tools:Track app crashes, screen load times, and user interactions to ensure optimal performance and user experience.
- Network Monitoring Tools: Monitor mobile network conditions, including latency and packet loss, to diagnose connectivity issues.
- Log Management Tools: Collect and centralize log data from mobile devices to facilitate troubleshooting and analysis.
- Real User Monitoring (RUM) Tools: Analyze actual user activities to gain insights into performance issues and user behavior patterns.
- Crash Reporting Tools: Automatically capture information when an app crashes, helping developers fix bugs efficiently.
What is Telemetry?
Telemetry is the automated process of collecting raw data from systems, applications, or devices and transmitting it to a central location for analysis. In the context of observability vs monitoring vs telemetry, telemetry serves as the foundational layer, providing the data that monitoring and observability tools rely on.
Types of Telemetry Data
- Metrics: These are numerical, time-series measurements that capture the state of a system at a specific point in time. System metrics like CPU load, memory usage, and disk I/O provide a quantitative view of system health. This performance data is efficient to store and process, making it ideal for dashboards and alerting on known conditions.
- Logs: Logs are timestamped, immutable records of discrete events that have occurred within a system. Application logs can contain detailed error messages with stack traces, records of user activity, or structured information about specific transactions. Log Management and Log aggregation tools are essential for collecting and searching these often-voluminous text files to debug specific incidents.
- Traces: Also known as distributed traces, these provide a detailed, end-to-end view of a single request or transaction as it moves through a complex distributed system. Distributed tracing is indispensable for understanding system behavior in modern microservice architectures, allowing engineers to pinpoint latency bottlenecks and failures within a long chain of service-to-service calls.
What is Observability?
Observability is the capability to infer the internal state of a system based on the data it produces. Unlike monitoring, which focuses on known issues and predefined metrics, observability empowers teams to explore unknowns and answer new questions as they arise.
Core Principles of Observability
- Exploratory Analysis: The hallmark of observability is the ability to freely explore and query system data without constraints. Engineers can slice and dice information across high-cardinality dimensions (like user IDs, tenant IDs, or request IDs) to isolate issues and understand their precise impact. This is fundamental to finding the root cause of novel or intermittent problems.
- Correlation Across Data Types: True insight comes from context. Observability platforms excel at linking metrics, logs, and traces together. An engineer can see a spike in a metric (the “what”), jump to the corresponding traces to see which service is slow (the “where”), and then drill down into the logs from that specific service instance to find the exact error message (the “why”). This seamless workflow is the key to efficient root cause analysis.
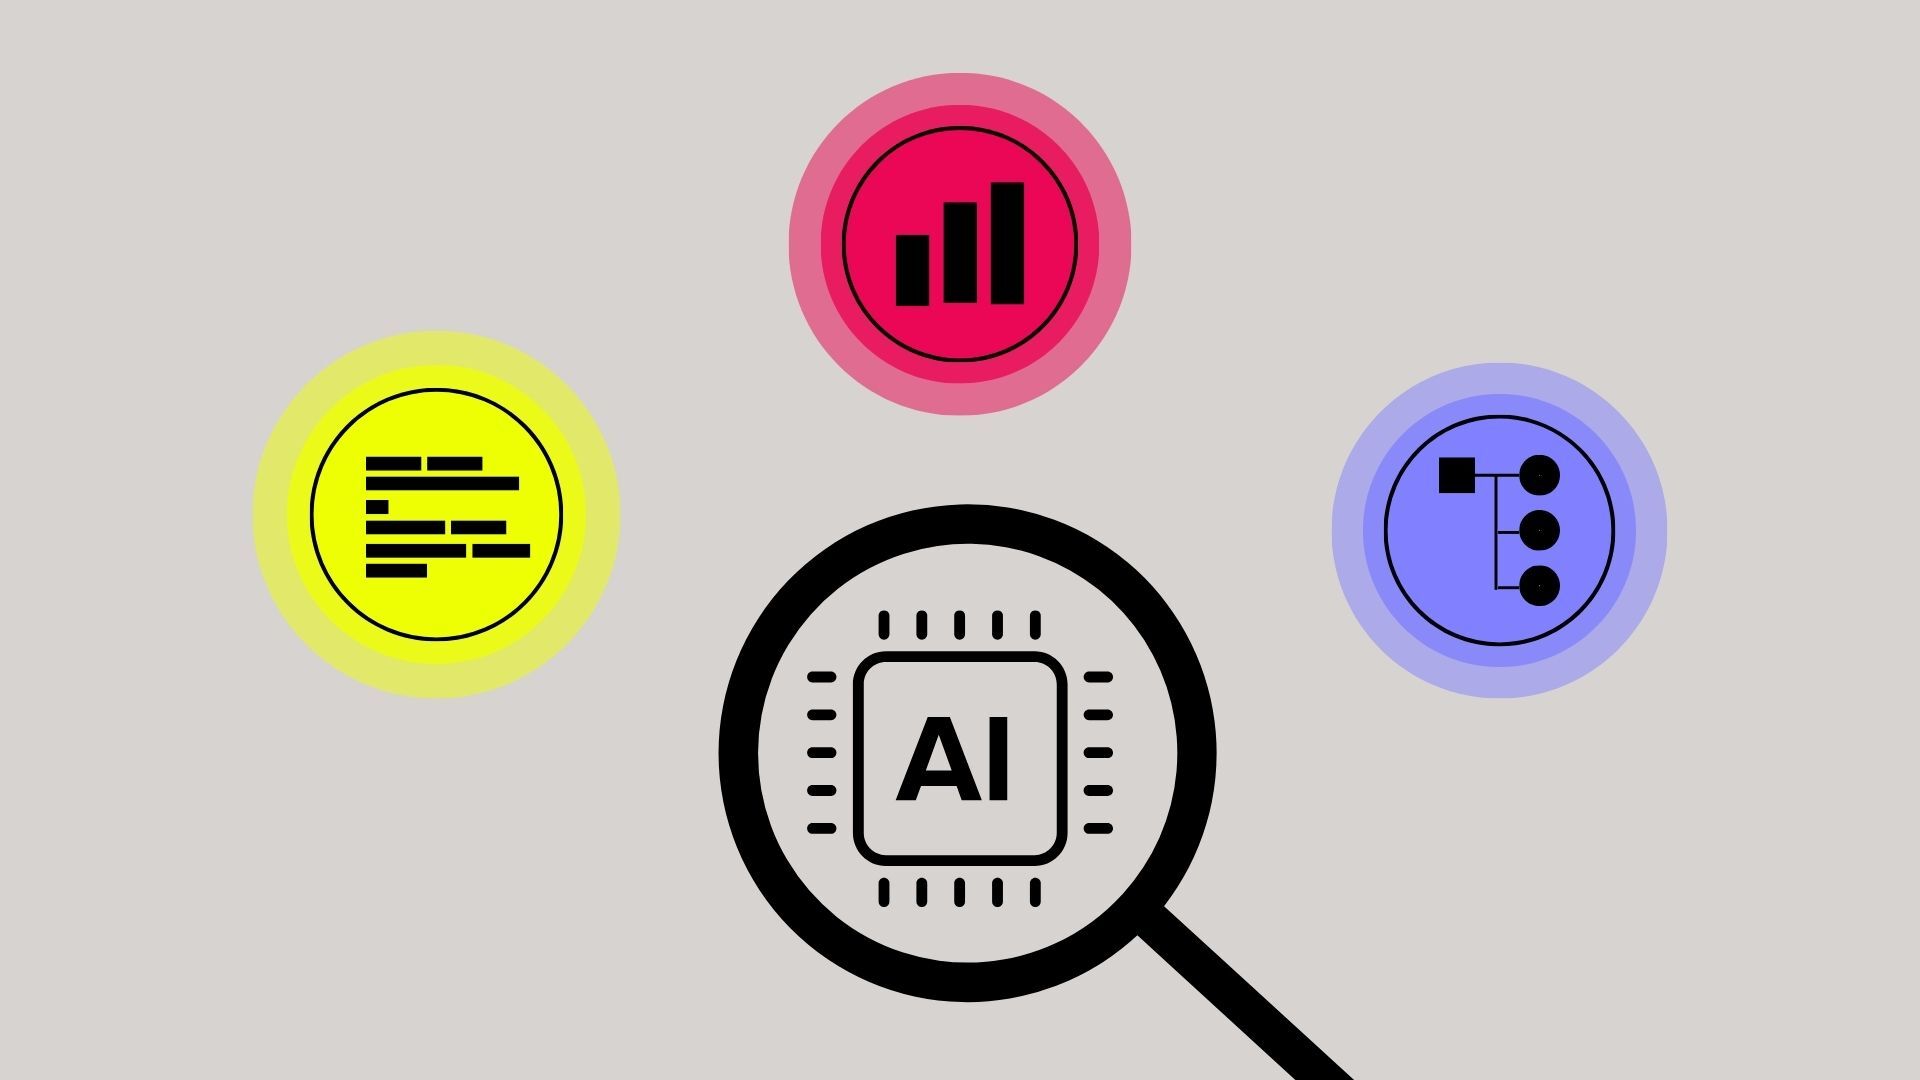
- AI and Machine Learning Integration: Modern observability is increasingly enhanced by Machine Learning (AI Integration). These systems can automatically detect anomalies, surface patterns in vast datasets that humans would miss, and provide AI-powered insights to guide investigations. The rise of generative AI is further transforming this space, with AI Assistants capable of summarizing incidents and suggesting remediation steps.
Key Differences Between Monitoring, Observability, and Telemetry
Understanding observability vs monitoring vs telemetry requires recognizing how these concepts interact and where they diverge:
| Aspect | Monitoring | Telemetry | Observability |
| Purpose | Detect known issues | Collect raw data | Diagnose unknown issues |
| Approach | Reactive (alerts on thresholds) | Foundational (data collection) | Proactive (exploratory analysis) |
| Data Used | Metrics (predefined) | Metrics, logs, traces (raw) | Metrics, logs, traces (correlated) |
| Outcome | Answers “What is wrong?” | Provides data for analysis | Answers “Why is it wrong?” |
| Example | Alert on high error rate | Collect all error logs and traces | Trace root cause of error spike |
In summary, telemetry provides the data, monitoring uses that data to detect and alert on known issues, and observability leverages all available data to understand and resolve both known and unknown problems. For managing critical applications, adopting all three practices ensures robust performance, rapid troubleshooting, and continuous improvement. Learn more about mobile app performance monitoring to strengthen your observability stack.
How Embrace Can Help
Embrace.io enhances mobile app monitoring, observability, and telemetry by centralizing data and offering insights for performance improvement. It consolidates metrics, logs, and traces for a comprehensive app health view.
The platform provides real-time alerts for quick issue detection and resolution. Embrace’s analytics help efficiently identify root causes, optimizing app performance and user experience. It integrates with existing tools, crucial for improving app observability and reliability.
Frequently Asked Questions
Monitoring tracks system health using predefined metrics, telemetry collects raw data, and observability enables deep analysis to diagnose both known and unknown issues.
Telemetry provides the foundational data—metrics, logs, and traces—that monitoring and observability tools need to function effectively.
No. Observability relies on comprehensive telemetry data to provide insights into system behavior and root cause analysis.
They ensure application reliability, enable rapid troubleshooting, and support compliance—critical for financial and tax-related platforms used by US expats.
Monitoring is essential but not sufficient. Observability, built on robust telemetry, is necessary to address complex, evolving issues in distributed environments.