Network Monitoring
Learn several strategies to mitigate the impact of networking issues in mobile apps.
This piece was originally published on The New Stack.
Sending and receiving data across the network is essential for mobile app functionality. So when networking problems happen, it can be incredibly disruptive and frustrating to end users.
What’s more, networking issues are often tricky to resolve because of their variability. They are not one specific type of problem, like crashes or “Application Not Responding” errors (ANRs).
Rather, we talk about “networking issues” as an umbrella term to encompass the many possible things that can go wrong in the process of requesting, receiving, and parsing data between the client and the server. Because so much is involved in this process — and much of it cannot be detected by monitoring at the server layer — there’s a lot to consider when instrumenting and observing networking conditions for mobile.

Networking events are responsible for sending and receiving essential data, so errors happening at this level can create all kinds of problems. Some common examples include:
All of these issues degrade user experience, potentially forcing end users off your app and in search of better-performing alternatives.
Unfortunately, poor networking conditions can also impact your ability to actually get the telemetry you need to evaluate app performance.
Consider any of the data you might be collecting about your app — crashes, logs and perhaps network requests with metadata. All of that telemetry must make its way to your observability provider’s servers, either as a payload sent at the end of a user session or via network requests sent in-session.
If the network connection is poor, that data may never get delivered.
So, your app might be plagued by networking problems that you can’t properly identify, because those same problems are preventing you from receiving useful data!
This is why building a robust observability pipeline that can handle and adapt to network instability is crucial. It’s also another reason why investing in client-side monitoring, in addition to server-side monitoring, is very important.
Resolving (and preventing) performance degradations that stem from networking problems requires a multi-step approach. While simpler issues can be tested in development, careful instrumentation of your app is essential to capture all of the unpredictable errors that inevitably happen in production.
The networking conditions that your end users are exposed to out in the world are completely unpredictable. That is the nature of mobile. Users may be moving in and out of service zones, switching from WiFi to a data carrier, or competing for bandwidth with a hundred other devices in their environment.
With disruptions in the available network, your app’s core functionality might be impaired or delayed. That’s why it’s crucial to test apps under various network conditions.
Simulating poor connectivity in a testing environment can help you identify performance issues early in the development cycle. You can do so by throttling the internet connection, testing with limited bandwidth, and simulating potential real user scenarios, like using the app in a basement or tunnel.
Through this process, you’ll be able to identify the basic, “low-hanging fruit” networking issues and ensure that your app can respond and adapt accordingly.
However, there will always be edge cases and complex scenarios that will pop up once your app is out in the wild. These you’ll observe via careful instrumentation.
When observing mobile apps, you have to shift your perspective from examining singular technical events, which backend monitoring tends to do, to looking at user experiences in their entirety.
The network request being issued and the data being received are but two components of the workflow. Knowing whether they have completed in their entirety and where they failed along the way — from the user’s button press to them seeing the effects on screen — is crucial in identifying all errors that happen on the app related to getting data from the server.
If the workflow failed because the request was never sent, or if the data coming back could not be parsed properly, you need to know that. The only way to do so is through instrumentation of the entire workflow, not just the actual time it took for the request to execute.
Latency on the wire is also a big cause of variability when it comes to network performance. Unlike backend infrastructure running in data centers, mobile relies on the completely uncontrolled environment of the internet. External variables like the strength of the network, the competition from other apps for device resources, and the behaviors of end users all impact how an app can perform. All of this context is completely lost if you limit your observability to singular network events, resulting in an incomplete picture of performance.
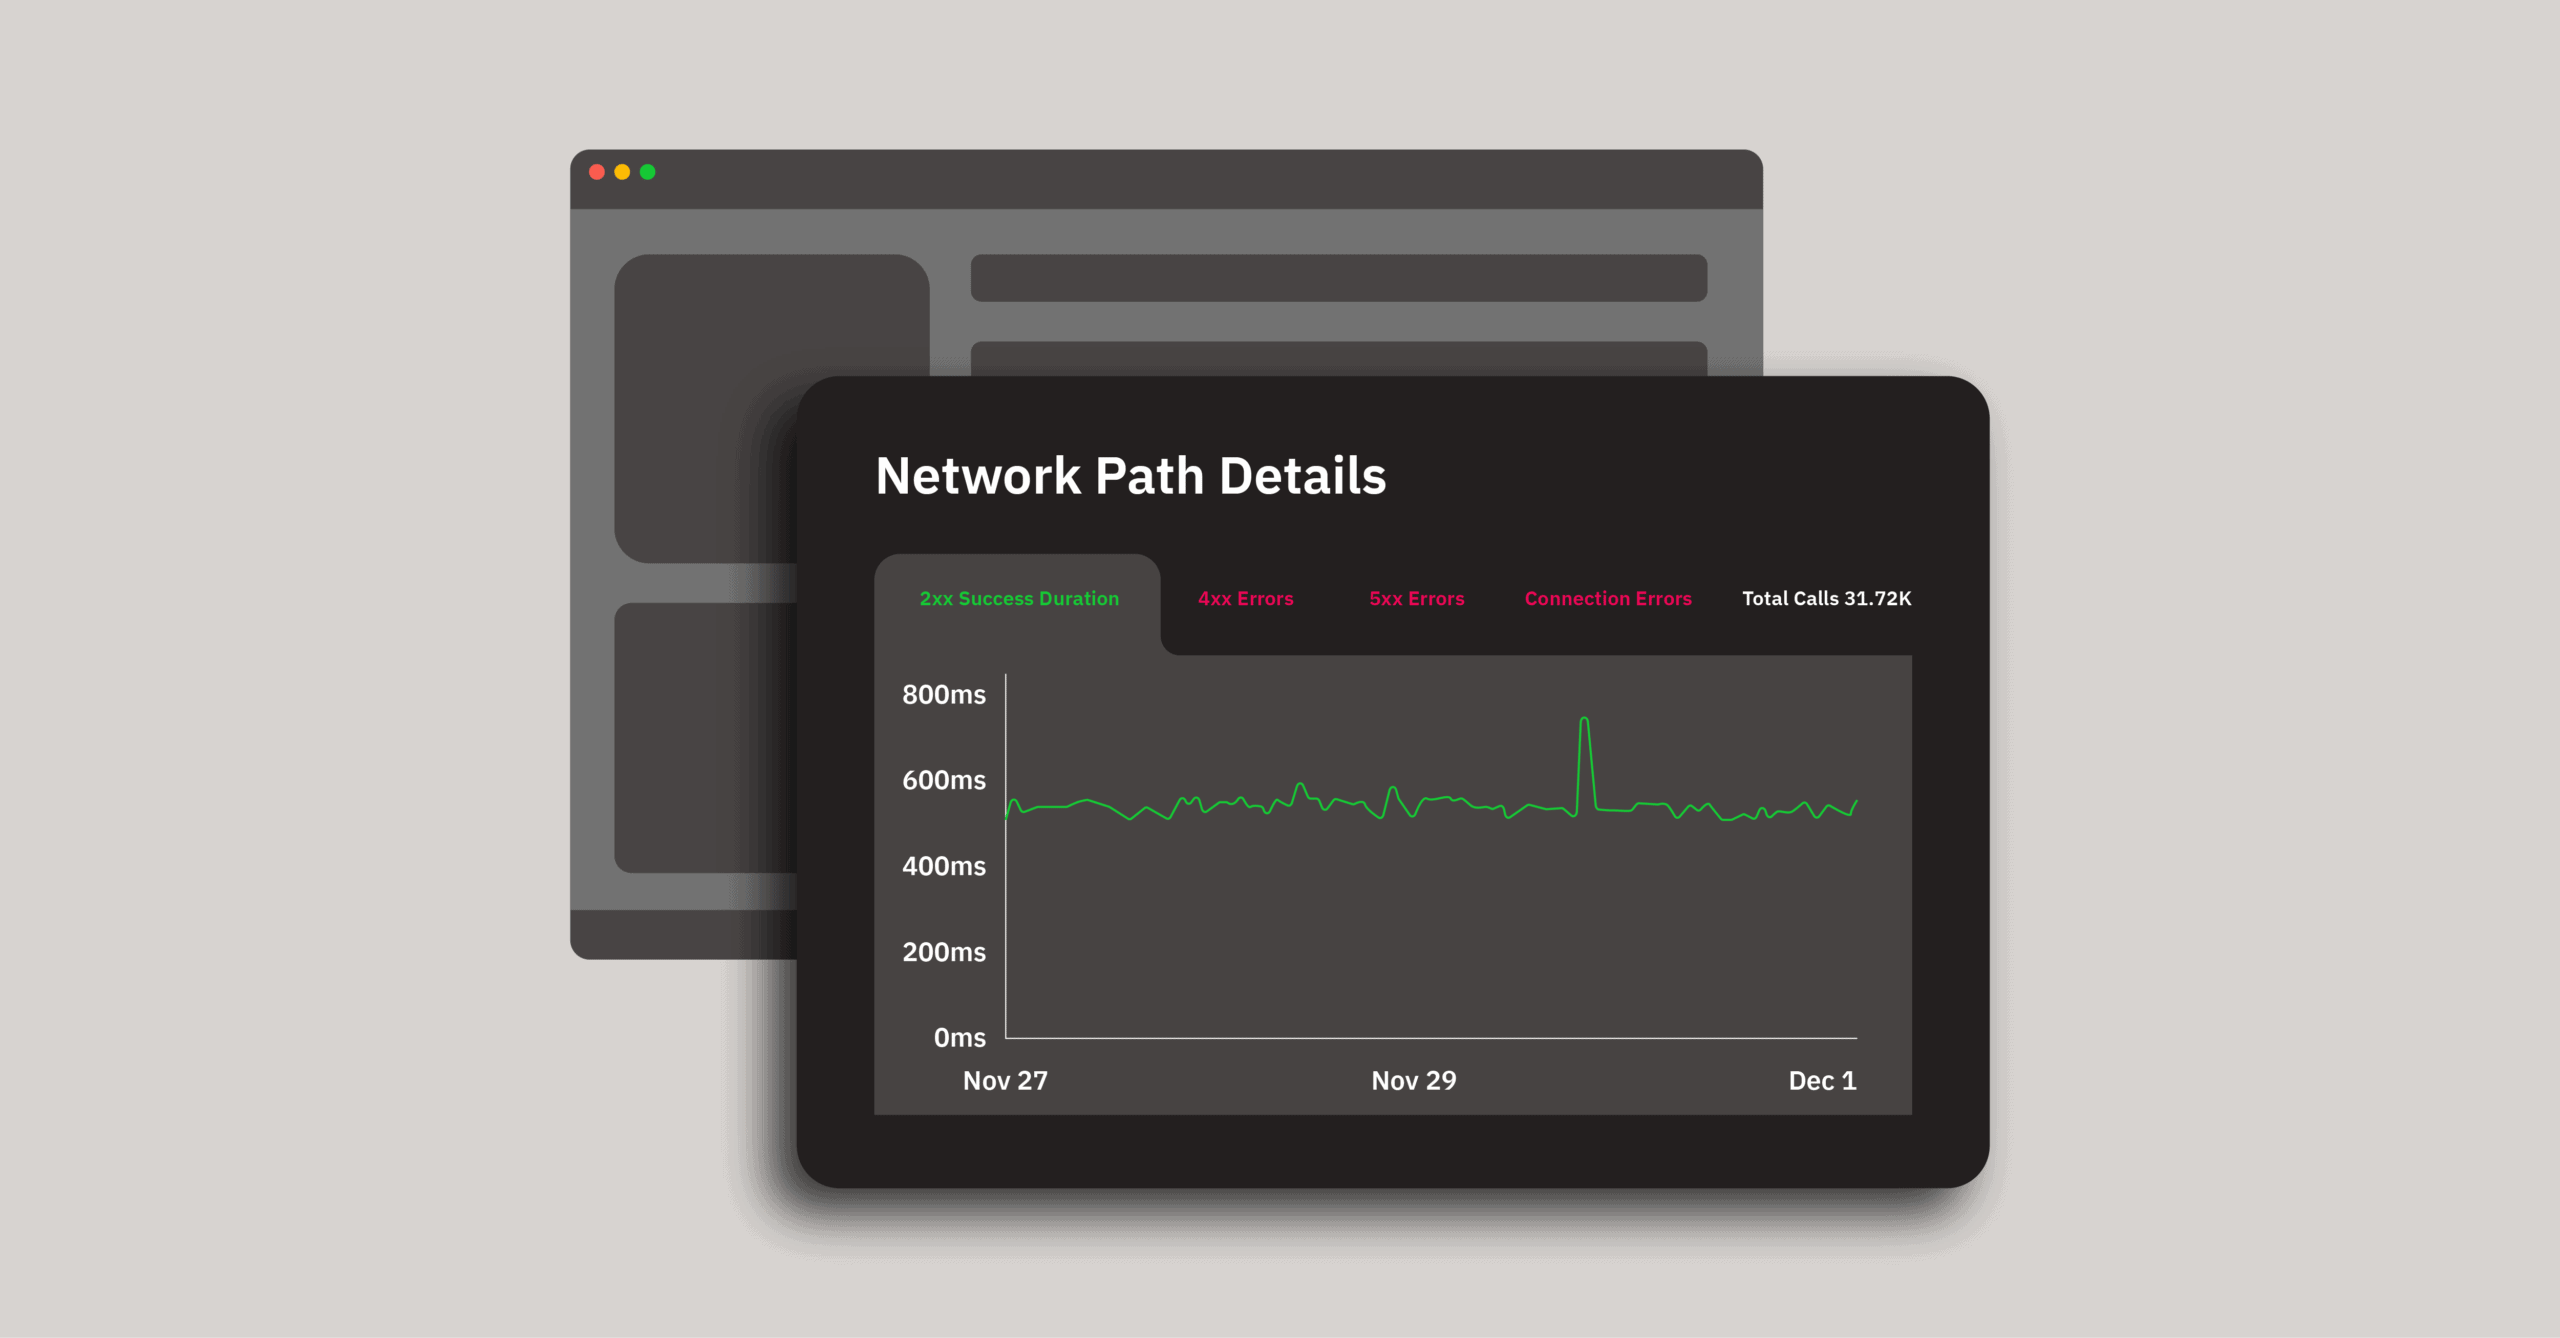
For example, say you are trying to determine if a networking issue is behind the latency of a user flow. You’ve instrumented your app so that it begins tracking the networking event as soon as the request goes out, and stops as soon as the response is received. If this is the extent of your instrumentation, it may look like the network events are fast enough. However, you’re missing essential context that could reveal sources of latency, such as:
These examples illustrate how hidden latency and errors outside of the network request itself can deeply frustrate your users, yet might not be caught without a holistic, end-to-end approach to instrumentation.

Evaluating context around network health also means looking at other players in the ecosystem, as they all impact resource availability.
One thing you can’t do much about is other apps. A user may have any number of apps on their phone trying to send background data across the network while actively using your app, thereby reducing available bandwidth. There’s no way to get visibility into this, and that is OK. Sometimes, just knowing that lower bandwidth — which you cannot control — is the root cause of performance issues is enough to try and mitigate them.
On the other hand, what you can control (to an extent) are the ecosystem players within your own app, such as third-party software development kits (SDKs).
A typical app incorporates about 18 SDKs, making these added software components big contributors to networking issues.
An analytics SDK, for example, may be using the same set of network connections to send data back to a server, forcing your app’s requests to wait. Or, an ad SDK may be fetching a giant video ad to display to your users, eating up bandwidth. If you’re already in a low-bandwidth environment, your app’s performance will degrade.
Any number of things could be going on across your app’s SDKs that impact performance. Luckily, you can get visibility into these issues with an observability tool and the right instrumentation.
Once you’ve identified the cause of a networking error, how do you know if it’s worth the engineering investment to resolve it? Like with any performance issue, it’s crucial to understand how it affects your user base and your app’s business model.
You’ll want to find out how often a networking issue occurs, how many end users it’s impacting, and what the “real” impact is on those users when it comes to continuously engaging with your app. For example, does the issue lead to force-quits? Does it lead to abandoned carts, or contribute to cancelled accounts? Does it drive users to your competitors?
This is the type of information that bridges the technical with the practical. You can glean these insights by looking at network performance data alongside other types of observability and product analytics.
For example, you can isolate users that are affected by certain network errors and correlate that information with product analytics data, such as conversion rates associated with a specific transaction affected by that error. Or, you can look at users on specific operating systems or devices that might be uniquely affected by an error and calculate their average customer spend, thereby quantifying the monetary value of an issue.
Whichever approach you take, overlaying networking errors with other types of data can help build a more complete picture of your app’s health and help you prioritize what to work on.

Network-related issues on mobile can be a “death by a thousand paper cuts” situation. While a single error may seem insignificant, collective errors can really degrade the user experience.
A few key strategies can mitigate this, such as simulating different conditions during testing, using highly precise observability tooling in production, instrumenting end-to-end user flows, and critically looking at the SDKs in your app.
Finally, it’s important to remember that resolving network issues is both a systemic and iterative process. Fixing a repeated error often requires addressing broader aspects of your app’s architecture to improve its overall resiliency. For example, you may discover you need to optimize your app’s retry strategies, consistently prioritize critical API calls over downloads or implement better caching mechanisms.
A comprehensive, mobile-specific approach to network monitoring can help you discover when those larger changes need to be made. And, with the right tools, you can make sure your app delivers an exceptional user experience, time and again — regardless of connectivity conditions.
Get started today with 1 million free user sessions.
Get started free